Uncovering Root Causes: A Guide to the Fishbone Diagram (Ishikawa Diagram)
10 min read
The ability to effectively diagnose and address issues is crucial for project quality management. In this article we are exploring the Fishbone Diagram’s visual format that is invaluable as a group creativity technique for brainstorming and problem identification.
What is a Fishbone Diagram?
The Fishbone Diagram, also known as the Cause and Effect Diagram or Ishikawa Diagram, is a powerful tool used for root cause analysis of problems. It helps in systematically identifying the various factors that contribute to an issue, breaking them down into more detailed causes and their root causes. By visualizing these relationships, the diagram aims to uncover the fundamental reason behind the problem of interest.
Additionally, it is often referred to as a group creativity technique, fostering collaborative problem identification and brainstorming. By involving multiple stakeholders in the process, diverse perspectives are considered, leading to a more comprehensive understanding of the issue.
How to Make a Fishbone Diagram: Structure and Methodology
To create a Fishbone Diagram, you start by placing the main problem in the "head" of the fish. From there, you branch out to identify major categories of potential causes, such as people, processes, equipment, materials, environment, and management. Each of these categories is then broken down further into more specific causes, which are subsequently decomposed into their root causes. This hierarchical decomposition helps in drilling down to the essence of the problem.
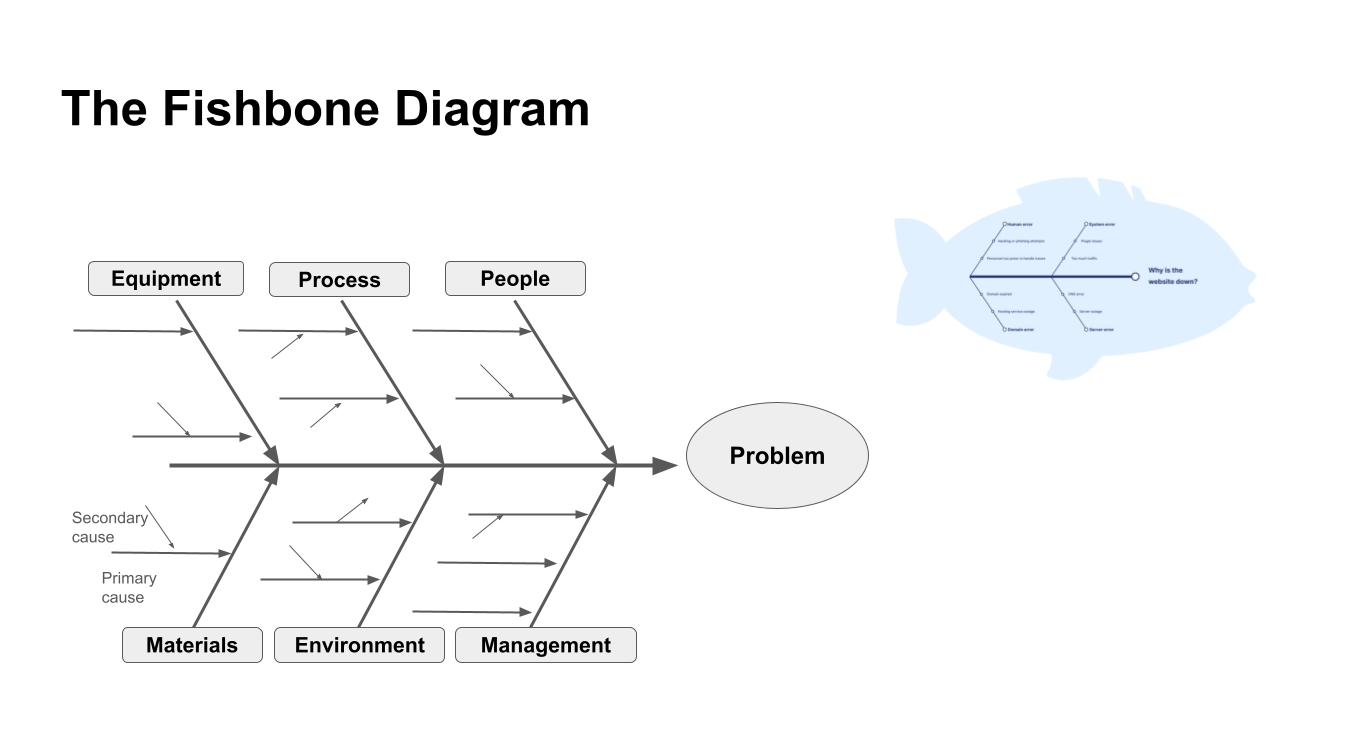
The diagram visually resembles a fish skeleton, with the main problem at the head and various causes branching out to form the body. The purpose is to systematically trace the origins of a problem to find the most significant underlying factors.
However, the Fishbone Diagram itself doesn't provide solutions; it merely helps in identifying key issues that need to be addressed. Other tools and methodologies are required for problem-solving.
Common High-Level Bones of the Fish
While the fish bones entirely depend on you problem, there are most common high-level categories that are recommended to start with:
- People. This category examines the human elements involved in the process. It includes staff, management, stakeholders, and customers.
- Process. This looks at the procedures and workflows. Inefficiencies, bottlenecks, and errors in the process itself can be root causes of problems.
- Equipment. Equipment and tools used in the process are considered here. Malfunctioning equipment, lack of proper maintenance, or outdated technology can be significant contributors to issues.
- Materials. The quality and availability of materials and inputs used in the process are crucial. Defective materials, shortages, or incorrect specifications can cause significant disruptions.
- Environment. This category includes the physical and organizational environment where the process occurs. Factors such as work conditions, ergonomics, and organizational culture can impact performance and outcomes.
- Management. The role of leadership and administrative actions are analyzed here. Poor management decisions, lack of strategic direction, or inadequate support can be root causes of problems.
The Fishbone Diagram Example: Group Creativity Technique
Now, let’s imitate a brainstorming session using the Fishbone Diagram template. The example scenario is based on the case of improving customer satisfaction in a retail store.
Use Case Setup
A retail store has been experiencing a decline in customer satisfaction. The management team decides to use a Fishbone Diagram as a group creativity technique to identify and address the root causes of this issue.
Steps to Conduct the Brainstorming Session:
Assemble the Team. Include team members from various departments such as sales, customer service, inventory management, and marketing.
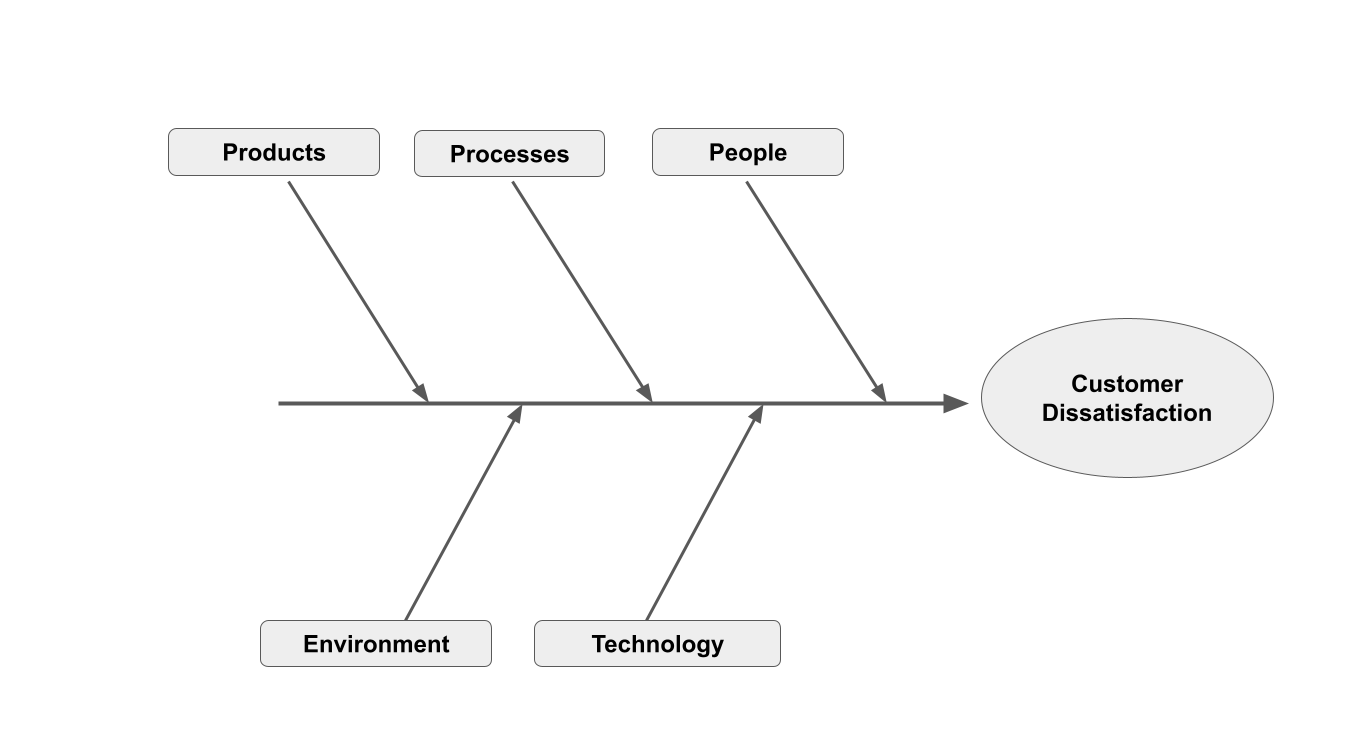
Define the Problem. Write the main problem (declining customer satisfaction) at the "head" of the fish.
Identify Major Categories. Ask the team to suggest major categories that could be contributing to the problem. Common categories might include:
- People (staff behavior and training)
- Processes (checkout procedures, returns policy)
- Environment (store layout, cleanliness)
- Products (quality, availability)
- Technology (point-of-sale systems, online presence)
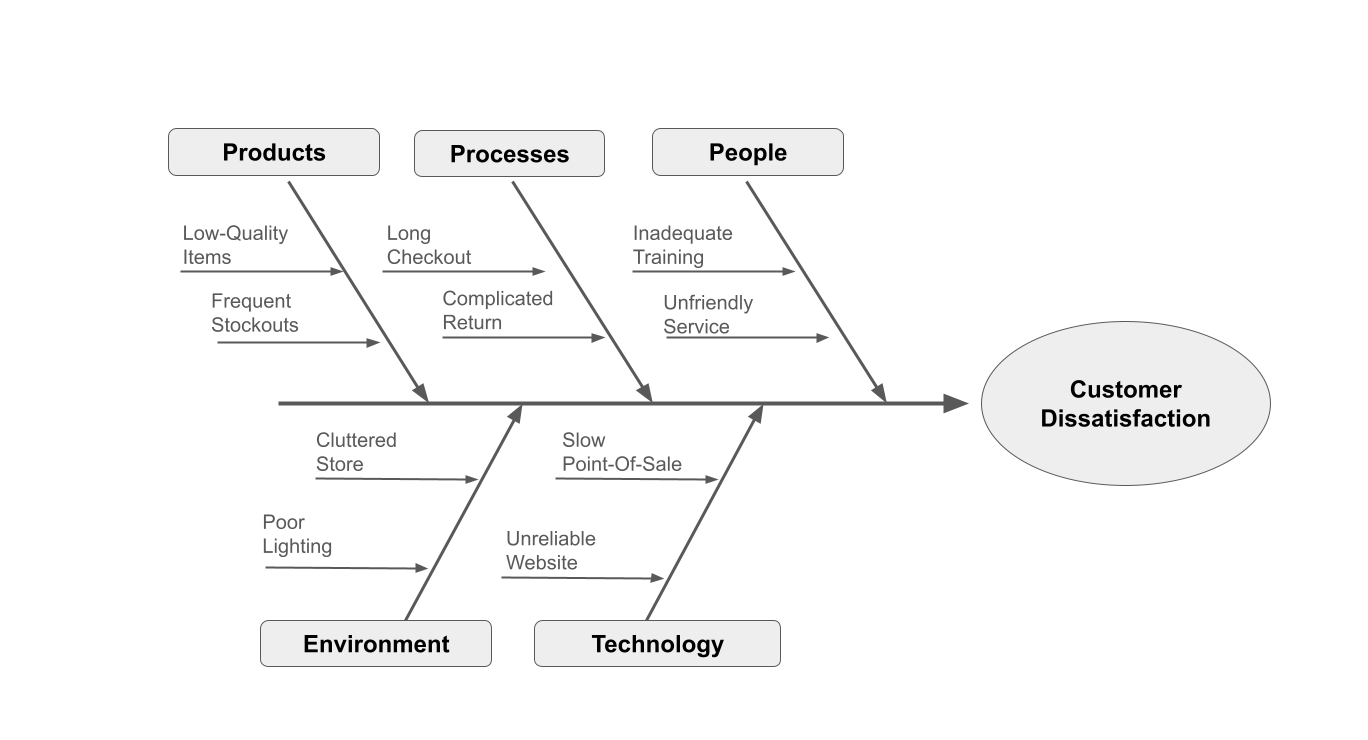
Brainstorm Specific Causes. Within each category, ask team members to brainstorm specific causes. Encourage open and free-flowing ideas without immediate criticism or evaluation. For example:
- People: Inadequate staff training; Unfriendly customer service
- Processes: Long checkout times; Complicated return policy
- Environment: Cluttered store layout; Poor lighting
- Products: Low-quality items; Frequent stockouts
- Technology: Slow point-of-sale systems; Unreliable website
Decompose into Root Causes. For each specific cause, ask "Why?" multiple times to drill down into root causes. For example:
Inadequate staff training:
- Why? Lack of a comprehensive training program.
- Why? No dedicated training manager.
- Why? Budget constraints.
Document and Analyze. Use the Ishikawa Diagram to visually map out the problem, categories, and causes. This will help in identifying the most significant root causes.
Prioritize and Plan. Discuss which root causes are the most critical and feasible to address. Develop action plans to tackle these root causes.
Outcome
The brainstorming session using the Ishikawa Diagram can lead to several actionable insights. For example:
- Implement a comprehensive staff training program by reallocating budget or hiring a training manager.
- Streamline checkout processes to reduce wait times and simplify the return policy.
- Improve the store layout and lighting to create a more pleasant shopping environment.
- Ensure better quality control and stock management for products.
- Upgrade the point-of-sale systems and enhance the website’s reliability.
By leveraging the group creativity technique through the Ishikawa Diagram, the retail store can systematically identify and address the root causes of declining customer satisfaction, ultimately leading to improved service and customer experience.

Conclusion
In conclusion, the Fish Bone Diagram, also known as the Ishikawa Diagram or Cause and Effect Diagram, is an invaluable tool for root cause analysis. Utilizing a root cause analysis template alongside this diagram can further streamline the process, helping teams systematically identify and decompose factors contributing to a problem, thereby uncovering its fundamental causes. This visual approach aids in understanding the relationships between various elements and their impact on the issue at hand.
By involving multiple stakeholders and fostering a collaborative environment, the Ishikawa Diagram not only enhances problem identification but also encourages diverse perspectives, leading to a more thorough fishbone analysis. While it is effective in pinpointing root causes, it is essential to complement this tool with other methodologies for developing and implementing solutions.
About the Author
Violetta Chernobuk is a skilled content strategist and writer at Planyway, specializing in crafting insightful and engaging articles on productivity and project management. With her keen eye for detail and a deep understanding of user needs, Violetta ensures that every piece of content is both informative and inspiring, helping readers optimize their workflows and stay ahead in their projects.