Calculating resource utilization: formula, benchmarks, and tips

Your team’s capacity is not fixed. A team that looks comfortably staffed today can quickly become overloaded when new work comes in, priorities shift, someone takes time off, or unexpected work takes up part of the schedule.
That’s what makes resource utilization important. It shows how much of your team’s available capacity is already committed to work, helping you understand whether you have room for more or need to rebalance the workload before things start slipping.
But to wield that number, you need more than just a percentage on the dashboard. You need to understand how the resource utilization formula works, what the resulting utilization rate actually tells you, and how planned and actual work compare.
TL;DR
- Resource utilization measures how much of a person’s or team’s available working capacity is allocated to or spent on work. Use planned utilization to test whether your future commitments fit inside real availability, then add actual utilization to the equation to learn what happened after the work was done.
- A high utilization rate is not automatically a sign of a healthy team. If every person is booked solid, work can wait longer between handoffs, blockers stay hidden, and delivery becomes less predictable.
- Good resource management combines a shared schedule, reliable time data, and regular course correction.
What is resource utilization in project management?
Resource utilization refers to the share of a person’s, team’s, or other resource’s available capacity that is used for work during a defined period. In people planning, it helps project managers see whether team members have too much work, too little work, or an amount that supports reliable delivery.
In a services setting, the metric often focuses on billable utilization: time spent on client work that can be invoiced. In an internal product team, it may include productive tasks such as discovery, design, development, testing, maintenance, and the coordination needed to ship client deliverables or internal releases.
There are two related, but distinct, views:
- Planned resource utilization looks ahead. It compares scheduled work with expected availability, making it useful for resource scheduling, staffing, and protecting commitments in a project plan.
- Actual resource utilization looks back. It compares logged work with available time, showing how people’s real weeks differed from the forecast.
Neither view should stand alone. Planned figures guide resource allocation for upcoming work, while actual figures show whether estimates, priorities, and assumptions deserve another look.
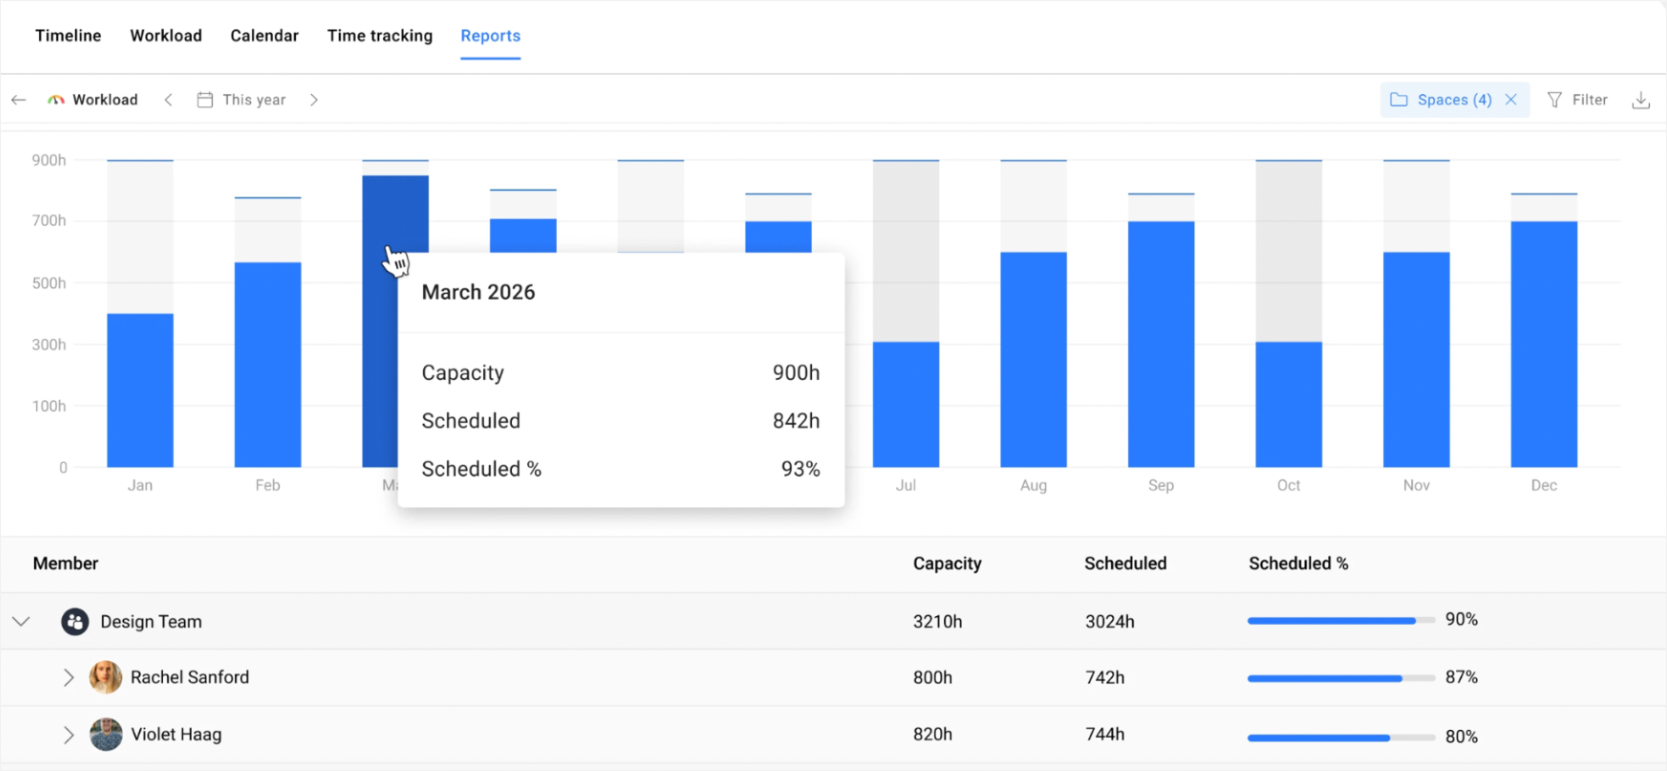
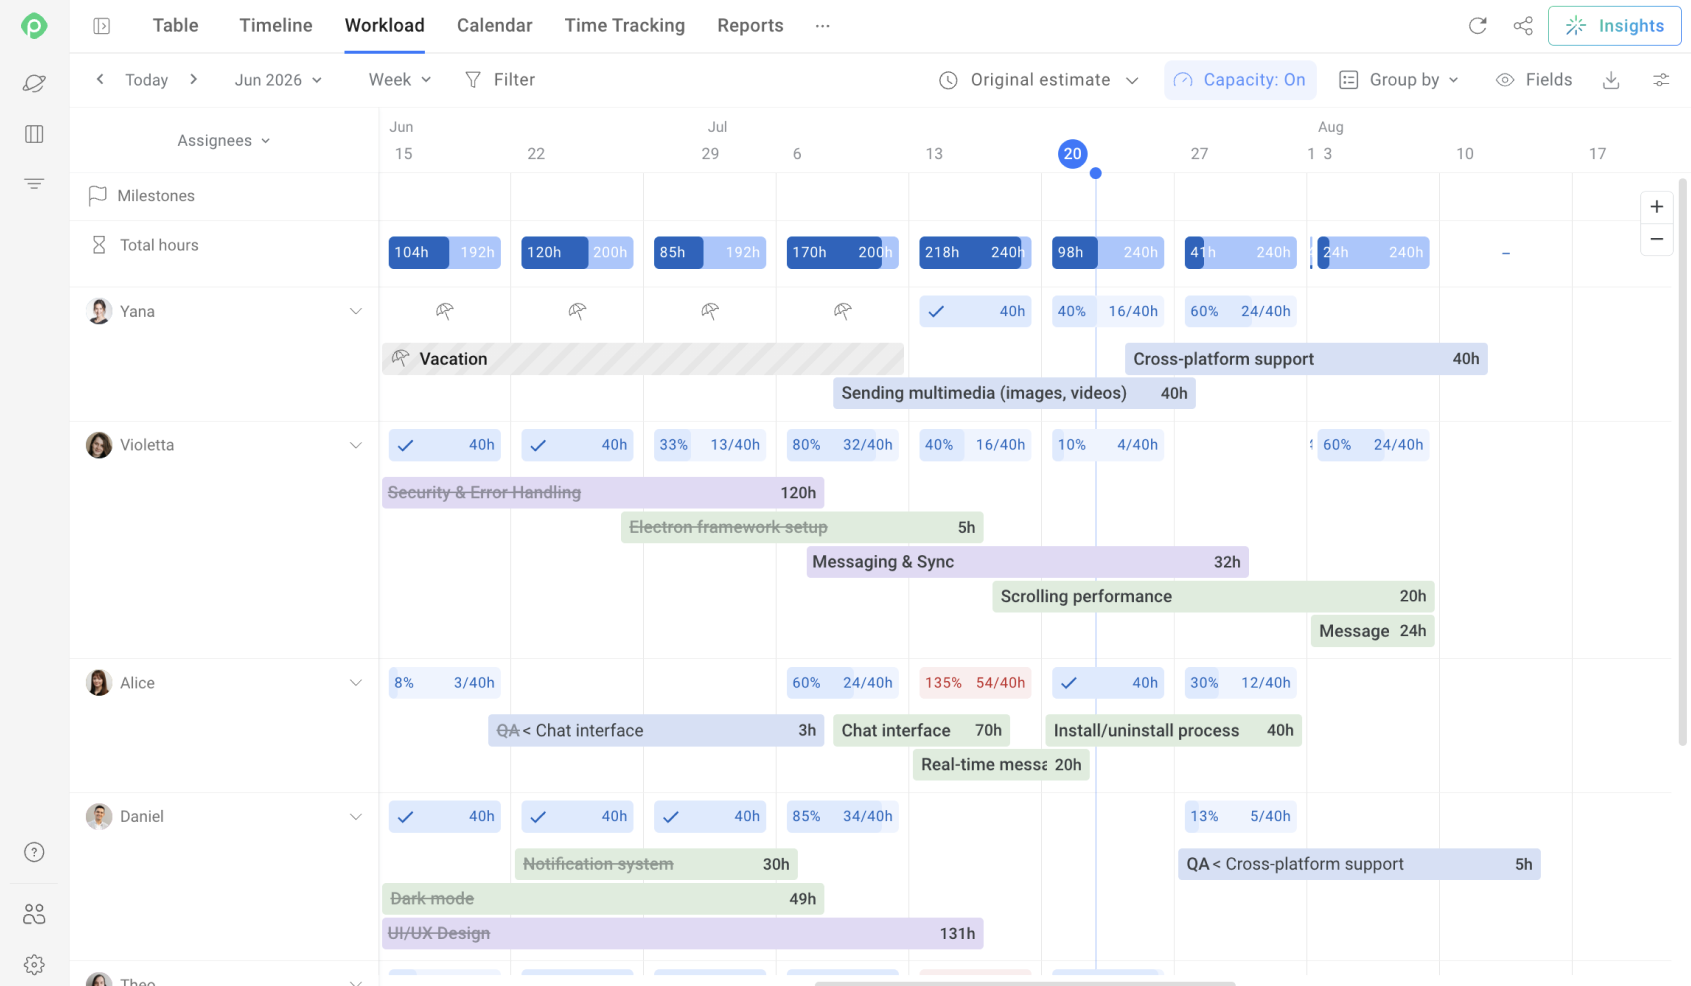
Planyway’s workload report compares scheduled work with available capacity and shows the resulting Scheduled vs. Capacity percentage at the team and individual level.
Utilization is closely connected to resource capacity — the workable time and capability your team has after leave, part-time schedules, and other constraints. That’s also why utilization is an important part of capacity planning.
Why people planners need to know resource utilization rate
As a product team behind Planyway, we’ve done a lot of interviews with Jira teams.
Resource and capacity planning was the primary reason teams adopted our planning tool in 82% of tagged use cases, according to Planyway’s own product usage data.
That makes sense. A project manager usually needs to answer, “Can we deliver this scope by this date?” A resource manager or PMO needs to see the wider pattern: who is committed across workstreams, where skills are becoming a constraint, which active projects compete for the same people, and whether today’s decisions leave room for future projects.
These roles meet at the same planning table, but their questions differ:
- Project leads use resource utilization to protect milestones, sequence dependencies, and avoid assigning tasks to people who are already committed.
- Resource leaders use it to balance skills, manage resource costs, forecast hiring or contractor needs, and make better trade-offs between billable projects, internal initiatives, and leave.
- Team leads use it to keep workload conversations grounded in visible facts rather than guesses.
And here's what the broader industry data shows about why this matters: PMI’s 2024 project-success research found that effective resource management was associated with a 3.1× higher Net Project Success Score. That alone highlights why capacity deserves attention early, before a looming deadline turns into a fire drill.
How to calculate resource utilization rate: basic formula
At its simplest, the typical resource utilization formula looks like this:
Utilization rate = (Total billable hours / Total available hours) × 100
Before you compare this number across teams or against outside benchmarks, define the numerator. Some organizations count only billable hours in the top line. Others also fold in internal work, learning, or delivery support. Both are legitimate choices, as long as you're consistent. Comparing your team's 75% against a benchmark that counted things differently isn't a utilization rate formula problem but a definition one.
If you're trying to calculate resource utilization rate for the first time, that single formula hides an important distinction. You should actually be running two versions of it: one looking forward, one looking back.
| What it answers | Formula | |
|---|---|---|
| Planned | "Do scheduled assignments fit available capacity?" | Scheduled Work ÷ Available Capacity × 100 |
| Actual | "How much available capacity did logged work consume?" | Logged Time ÷ Available Capacity × 100 |
If you only ever track one of these, pick actual — it's the one grounded in actual hours spent. But planned utilization is what lets you catch an overload before it happens, so the two work best in tandem.
Planned resource utilization formula
Planned resource utilization = Scheduled Work ÷ Available Capacity × 100
The formula is straightforward: divide the amount of work scheduled for a person by the amount of time they actually have available to work during the same period.
For example, if someone has 30 hours of available capacity and 24 hours of work scheduled, their planned utilization is 80% (24 ÷ 30 × 100). The remaining six hours aren't necessarily wasted — they leave room for coordination, reviews, support work, and unexpected requests.
The important part is getting both numbers right.
Scheduled work is the easy half — it's simply the hours you've assigned to a person for a given period, whether that's a sprint, a week, or a month.
Resource availability is the half people get wrong. It doesn't mean every hour a person is theoretically reachable — it means their paid working time during that period, and that number is almost always smaller than it looks on a calendar. To get it right, start from standard working hours (40 hours a week, or whatever is in the contract) and subtract:
- Public holidays
- Planned vacation or PTO
- Sick days, if known in advance
- Company-wide training days
That's a fair amount of actual time to track and reconcile by hand, and doing it in a spreadsheet is exactly the kind of administrative tasks that quietly eat into the hours you're trying to measure in the first place. Most teams find it's less error-prone to let a workload or resource management tool handle the subtraction automatically instead of rebuilding it every sprint.
Planyway for Jira calculates capacity based on team members’ working schedules and visualizes it alongside scheduled work. You can account for holidays and days off, configure custom working hours for part-time team members, and see when scheduled work exceeds available capacity.
In other words, Planyway brings both sides of the planned utilization equation together: how much work is scheduled and how much capacity is available to do it.
Actual resource utilization formula
Actual utilization looks backward. Take the total time actually logged on both billable and non-billable tasks over a given period, divide it by the available capacity for the same period, and multiply by 100.
Actual resource utilization = Logged Time ÷ Available Capacity × 100
For a strictly billable measure, the same formula narrows to:
Billable utilization = Total billable hours ÷ Total available hours × 100
Actuals are also the fastest way to spot a bad estimate rather than a slow team. If actual time spent keeps outrunning scheduled work on the same type of task, sprint after sprint, the fix usually isn't “work faster” — it's unclear requirements, missing review time, or a plan that assumed nothing would ever have to wait its turn. Treat a persistent planned-vs-actual gap as a signal to revisit how you estimate, not as a productivity problem to manage around.
By the way, Planyway’s time tracking records actual effort against Jira work items, while the Planned vs. Tracked Report compares planned and tracked time, helping you spot variances and improve future estimates and capacity plans.
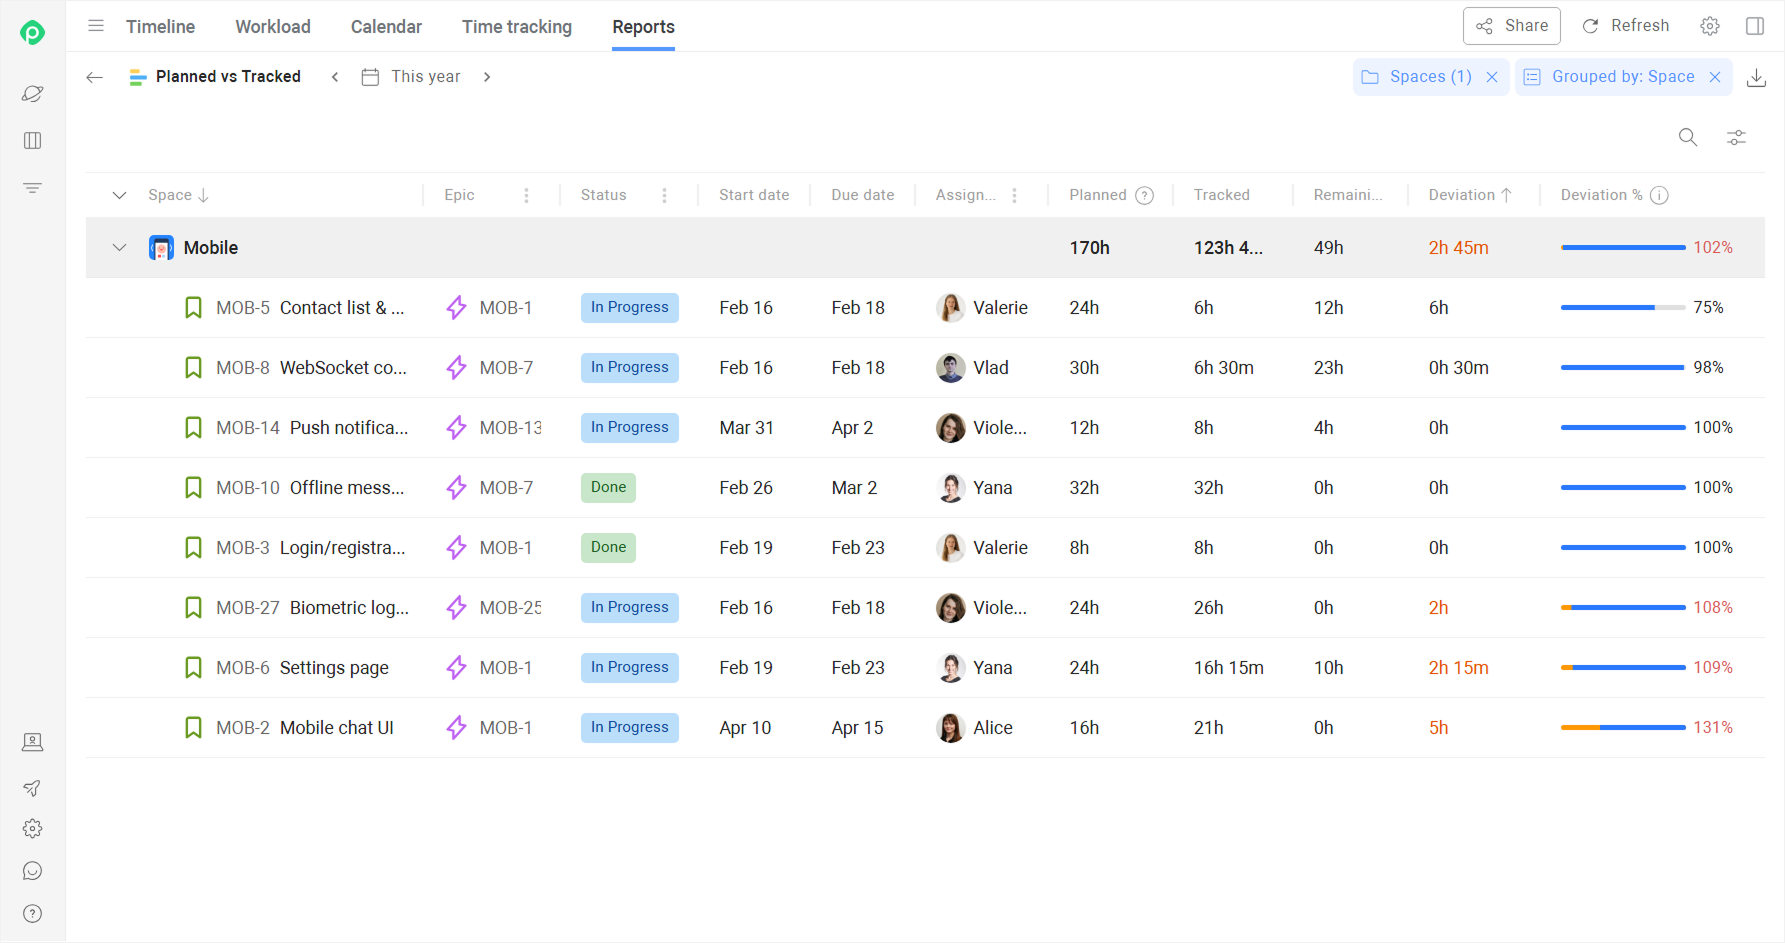
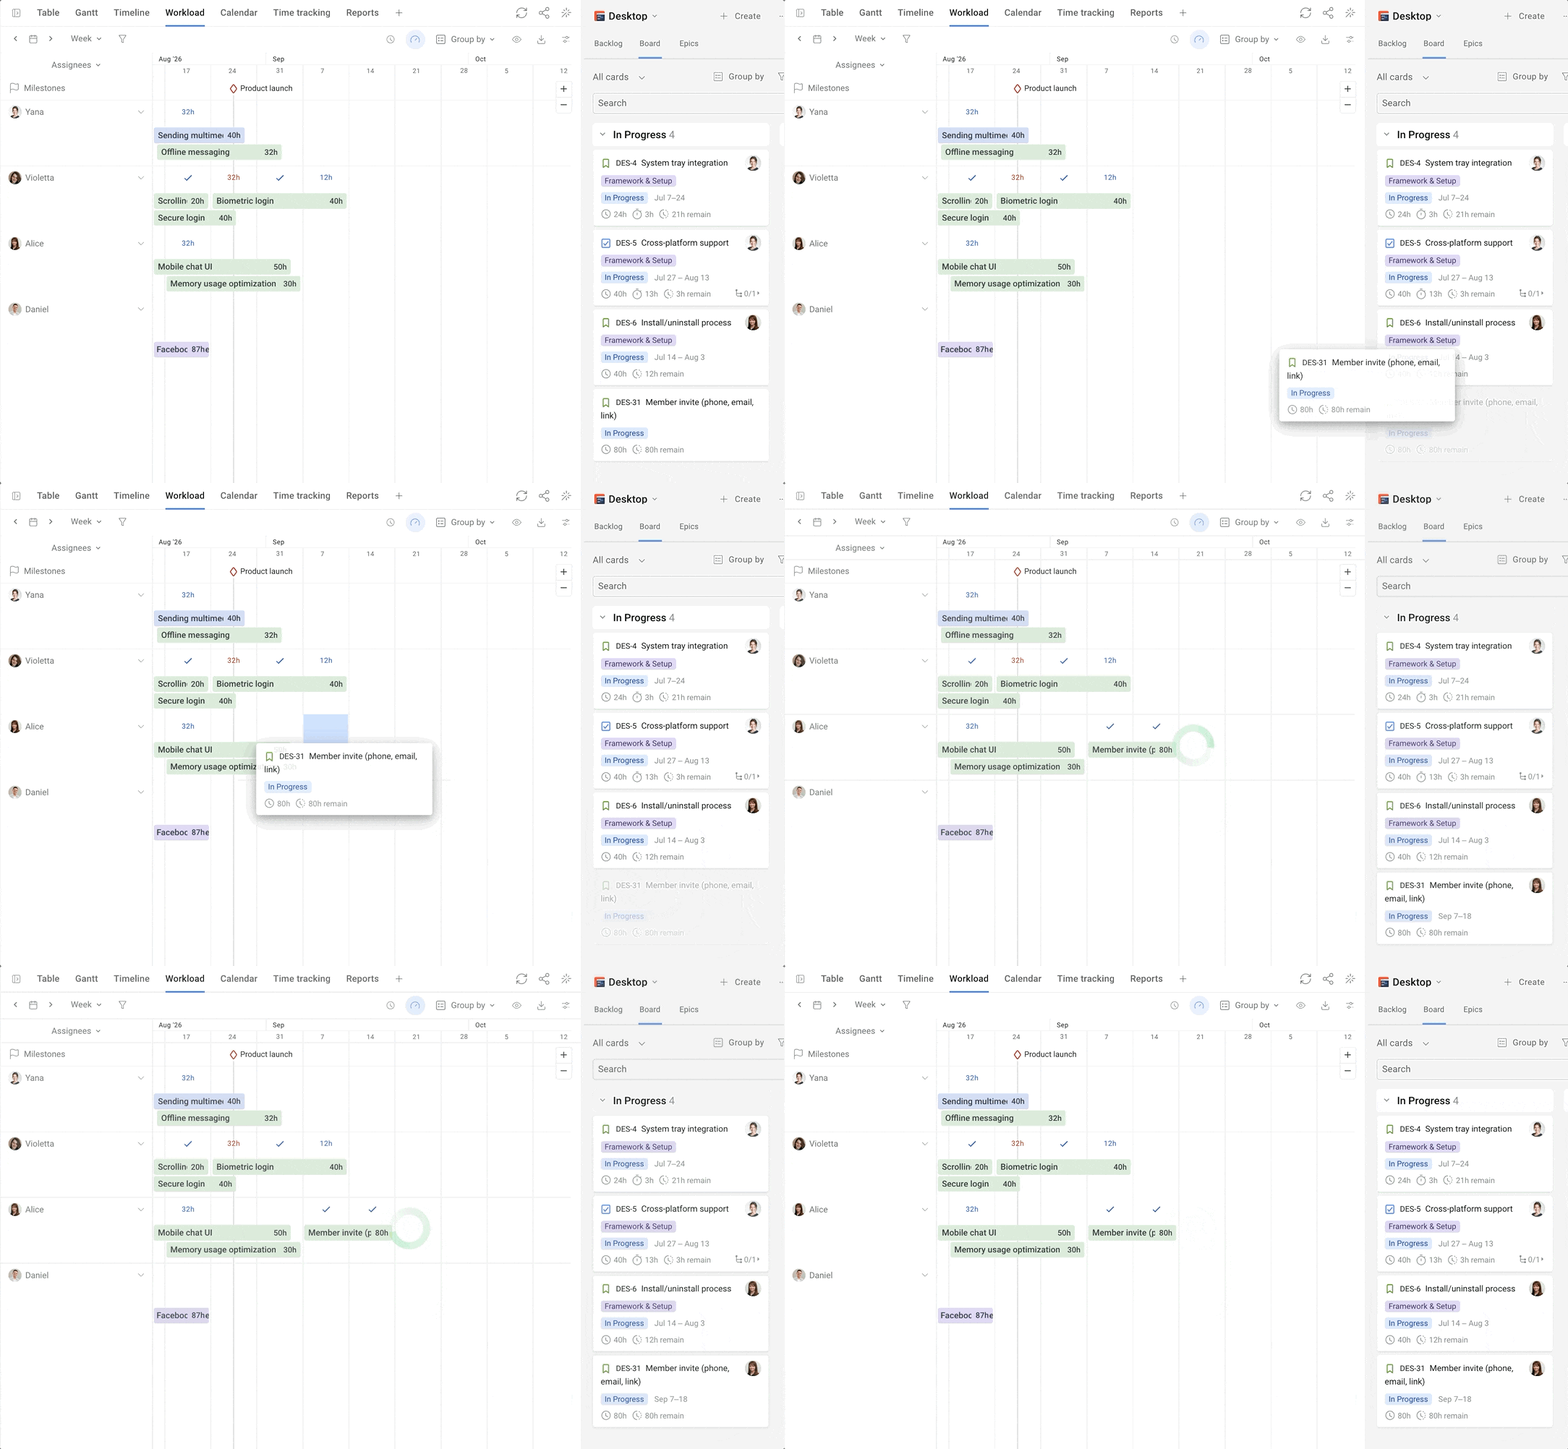
If you consistently see that actual work exceeds scheduled work, adjust the plan rather than simply recording the difference. Revisit estimates, reassign work where appropriate, move lower-priority tasks, change the sequence, or adjust delivery dates.
In Planyway (sorry for another shameless plug 😊), these changes can be made directly in the planning view, so your schedule can evolve as priorities and actual workload change.
What is a good resource utilization rate?
A good rate depends on the role, industry, and firm strategy. A consultant working mainly on client delivery has a different target from a people manager, a support lead, or a product engineer whose week includes collaboration, quality work, and internal responsibilities.
Across industry benchmarks, the average employee billable utilization was 66.4% in 2025, down from 68.9% in 2024, according to SPI Research's 2026 Professional Services Maturity Benchmark, which surveyed 509 firms.
A proper utilization rate is widely cited in the 60–80% range, with 75% commonly described as the optimal benchmark. Everything above the range of roughly 85–90% increases burnout risk, while the range below roughly 60–65% may signal underuse.
This benchmark is useful context for project profitability, labor costs, and financial health, but it should not erase the needs of roles that carry necessary non-billable tasks.
A sensible target also depends on the cost of delay. If a team must respond quickly to incidents, approvals, or client changes, spare capacity is part of the service. If work is predictable and repeatable, a higher planned rate may be workable. Your own employee utilization rates should reflect the work you actually expect people to do.
Why aiming for ideal resource utilization is a trap (aka the best advice on improving your %)
Picture a small delivery line with four people. Every piece of work must pass from one person to the next before it can be finished. A manager sees empty hands as a problem, so they keep feeding new work into the line and make sure every desk stays full.
For a while, the team’s utilization looks excellent: everyone is busy. But work starts piling up between stages, so the calendar looks full while the delivery board barely moves.
This is the central tension in managing resource utilization. Work in progress creates waiting time. A person at maximum load has little room to review a teammate’s output, resolve a blocker, handle a changed requirement, or complete the final small step that turns “nearly done” into done.
A team that pulls in new work only when it has room will often show a lower utilization rate on paper. Yet it can produce more completed work because items keep moving. That is effective resource utilization: capacity supports flow, rather than becoming a score to maximize.
Use utilization as a diagnostic dial. First, look at whether work finishes predictably, handoffs are timely, and blocked items are visible. Then adjust assignments to support that flow. Optimal resource utilization means enough focused work to use people’s skills well, plus enough space to keep work moving.
How to improve resource utilization without burning out your team
Start by fixing the inputs. If availability ignores leave, recurring ceremonies, mentoring, or support work, the number is misleading before anyone opens a report. Account for overhead costs in time as well as money: coordination and quality checks may not be billed, but they protect delivery.
Then use these practical habits:
- Plan work at the level of individual team members when their skills or commitments differ. Team averages can hide one overloaded specialist behind several people with free time.
- Limit parallel work. Fewer open items reduce context switching and make it easier to see what is blocking completion.
- Reserve capacity for expected unplanned work instead of treating every request as an exception.
- Match assignments to skills and actual availability. Sending work to whoever appears free can create rework, delay, and avoidable resource costs.
- Review utilization alongside completion, quality signals, and project performance. A full calendar does not prove that the right work was delivered.
- Use trends to guide financial forecasting. If a services team expects less billable demand, the answer may be a sales or staffing decision—not pressure on people to invent billable work.
The goal is to use available resources well while leaving enough margin for work to move. That supports the team's productivity, protects employee satisfaction, and makes delivery more reliable. It also gives resource managers a better basis for deciding when additional capacity is truly needed.
Common resource utilization mistakes to avoid
- Counting calendar time as capacity. A 40-hour week is not automatically 40 hours of assignable work once leave, meetings, support duty, and internal obligations are included.
- Combining every work type into one number. Track revenue-generating work, internal effort, and non-billable hours separately so you can understand the trade-offs behind the total.
- Treating 100% as the target. This leaves no room for review, blockers, unexpected requests, or the small coordination steps that help work finish.
- Looking only at team averages. A team can appear balanced while one critical person carries the work that determines whether a deadline holds.
- Measuring without acting. A report that identifies overload but does not lead to changed scope, sequencing, staffing, or priorities is just documentation.
- Using the metric to judge individual effort. Utilization reflects the system around people: demand, estimates, role design, approvals, and resource allocation. Use it to improve planning, not to create fear.
Final thoughts
Calculating utilization rates includes comparing the work you plan or log with the capacity people truly have. The percentage alone won’t tell you whether the plan is working. Look at whether work is getting finished and whether the team can keep up at a sustainable pace.
Real-time visibility into schedules, availability, and workloads makes planning conversations clearer and helps allocate project resources efficiently. To that end, dedicated resource management software can relieve you of endless spreadsheet juggling and visualize capacity and commitments in the same place.


FAQ
To calculate resource utilization, use the utilization formula: total billable hours divided by total available hours, multiplied by 100. For planned work, divide scheduled work by available capacity; for actual work, divide logged time by available capacity.
To optimize utilization, start with accurate availability, then balance work across skills and priorities. Reduce avoidable work in progress, protect some capacity for unplanned tasks, and compare plans with actual results before changing future assignments.
The main types are planned and actual utilization. You can also measure billable utilization, total utilization, and a capacity utilization rate, depending on whether you need to study scheduled work, logged effort, revenue-related work, or use of available capacity.
In operations management, utilization measures how much of a resource’s available capacity is being used over a period. It can apply to people, equipment, facilities, or other project management tools and assets involved in delivering work.