Resource forecasting: PM planning techniques and tools

Any PM who’s worked on their position for some time knows their team — things like who’s on what sprint, who’s off in December, and whether all deadlines are realistic. However, predicting what January and further will look like once you stack the roadmap and “also add that one little thing” is much, much harder.
Worry not (or maybe, worry a little bit less), because this is what resource forecasting is for.
In this guide, we'll take that exact question and walk through how a resource forecast actually gets built, using a fairly typical product team of 11: two backend developers, three frontend developers, three mobile developers, two QA engineers, and one designer. And while we’re there, we’ll cover which methods are helpful, where dedicated resource forecasting software is necessary, and when a spreadsheet is just enough.
TL;DR
- Resource forecasting in project management predicts future resource needs by comparing upcoming work with actual team capacity to identify skill gaps and potential bottlenecks early.
- Combine forecasting methods to improve accuracy. Use expert estimates for new projects, historical data for recurring work, and scenario modeling to prepare for uncertain outcomes.
- Review and update your forecast regularly. Account for vacations, support work, and realistic availability, and use tools like Planyway for Jira to visualize workloads, track capacity, and optimize resource allocation.
What is resource forecasting?
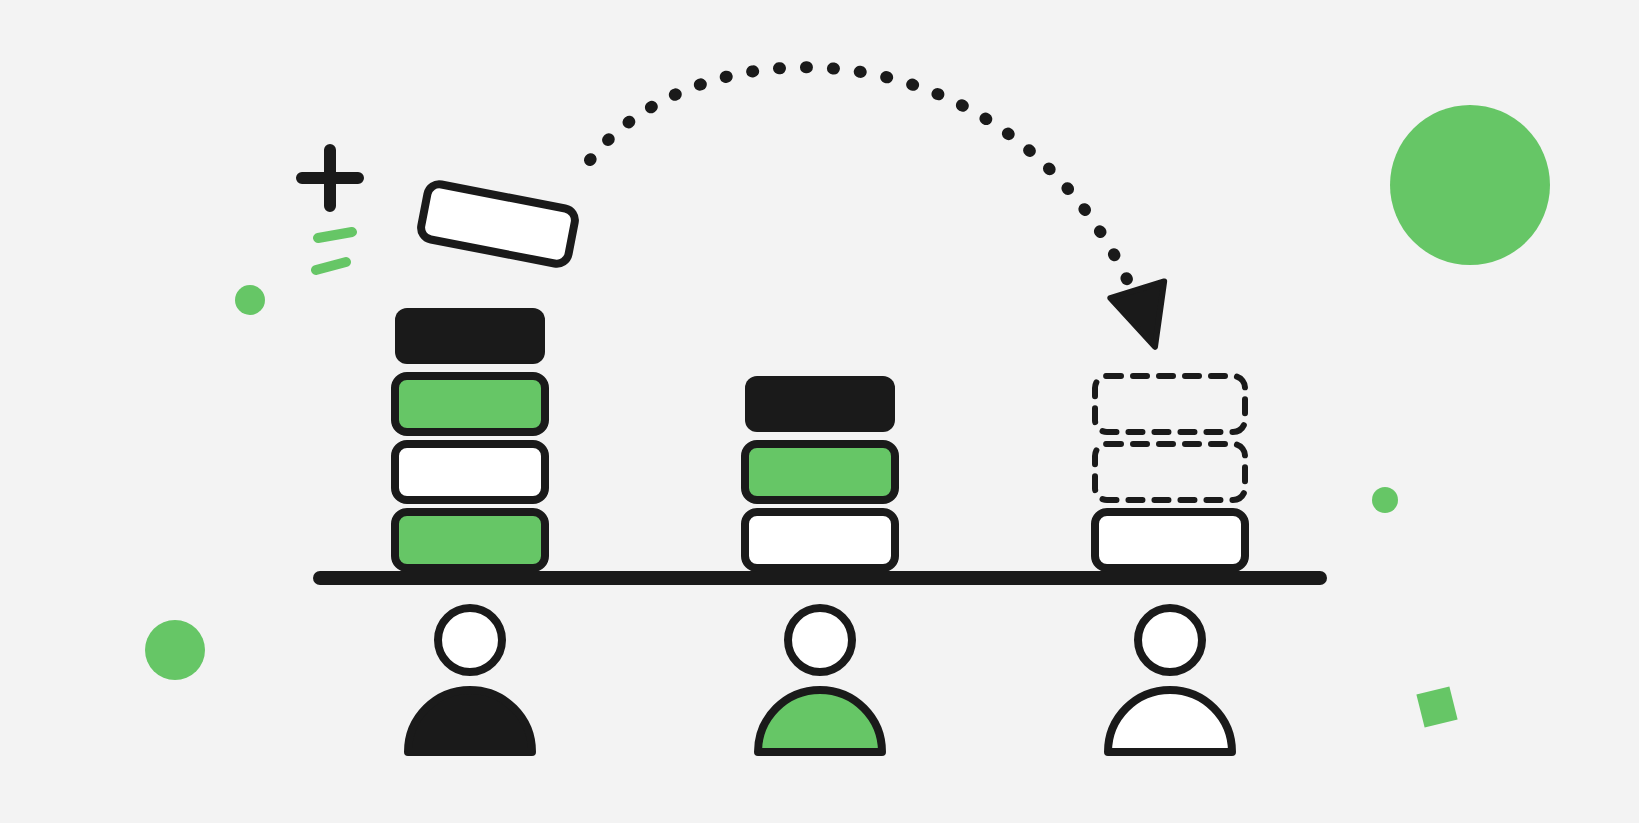
Resource forecasting is predicting the future demand for and availability of project resources such as personnel, skills, equipment, materials, and budget. It can cover anything from the next few sprints to several quarters or longer, depending on the decision you need to make.
A big part of effective resource forecasting is also comparing the demand with the capacity you expect to have. Done right, it tells you what the work will need, when it’s needed, and whether your team is capable of delivering it.
Great, but what is the difference between resource planning and capacity planning, then? Let’s dig into that, too.
Resource forecasting vs. resource planning vs. capacity planning
The confusion is because these terms sometimes get used interchangeably, and that’s not exactly right. Let’s separate them:
| Question it answers | Horizon | Level of detail | Result | |
| Resource forecasting | What will future work need, and will we have it? | Weeks to a few quarters | Roles and skills, rough hours | Gaps, scenarios, early warnings |
| Capacity planning | Do we have enough bandwidth, and how do we get more? | Quarters to years | Teams and the org | Hiring, contractor, and Lead/Lag/Match decisions |
| Resource planning | Who works on what, and when? | The current project or next few sprints | Specific people and tasks | Assignments |
| Resource scheduling | When exactly does each person do each task? | Days to weeks | Tasks on a calendar | A schedule |
Resource forecasting estimates what future work will require and what capacity is likely to be available. Capacity planning uses those forecasts to decide what the team can take on, and what needs to change if demand exceeds capacity. They overlap, but neither is simply a subset of the other.
A quick note: in project management, "forecasting" also refers to predicting a project delivery date and final cost, usually once it's about 20% complete and there's enough real data to go on. It’s pretty close to what we’re explaining here, and the calibration part of this guide applies to it too. But in this article, we lean more into human resource forecasting.
What goes into a resource forecast
Accurate resource forecasting usually has two sides: the work that's coming (demand) and the time your people will actually have (supply). Math is the easiest part, because it’s a lot harder to make sure that nothing from either side is missing.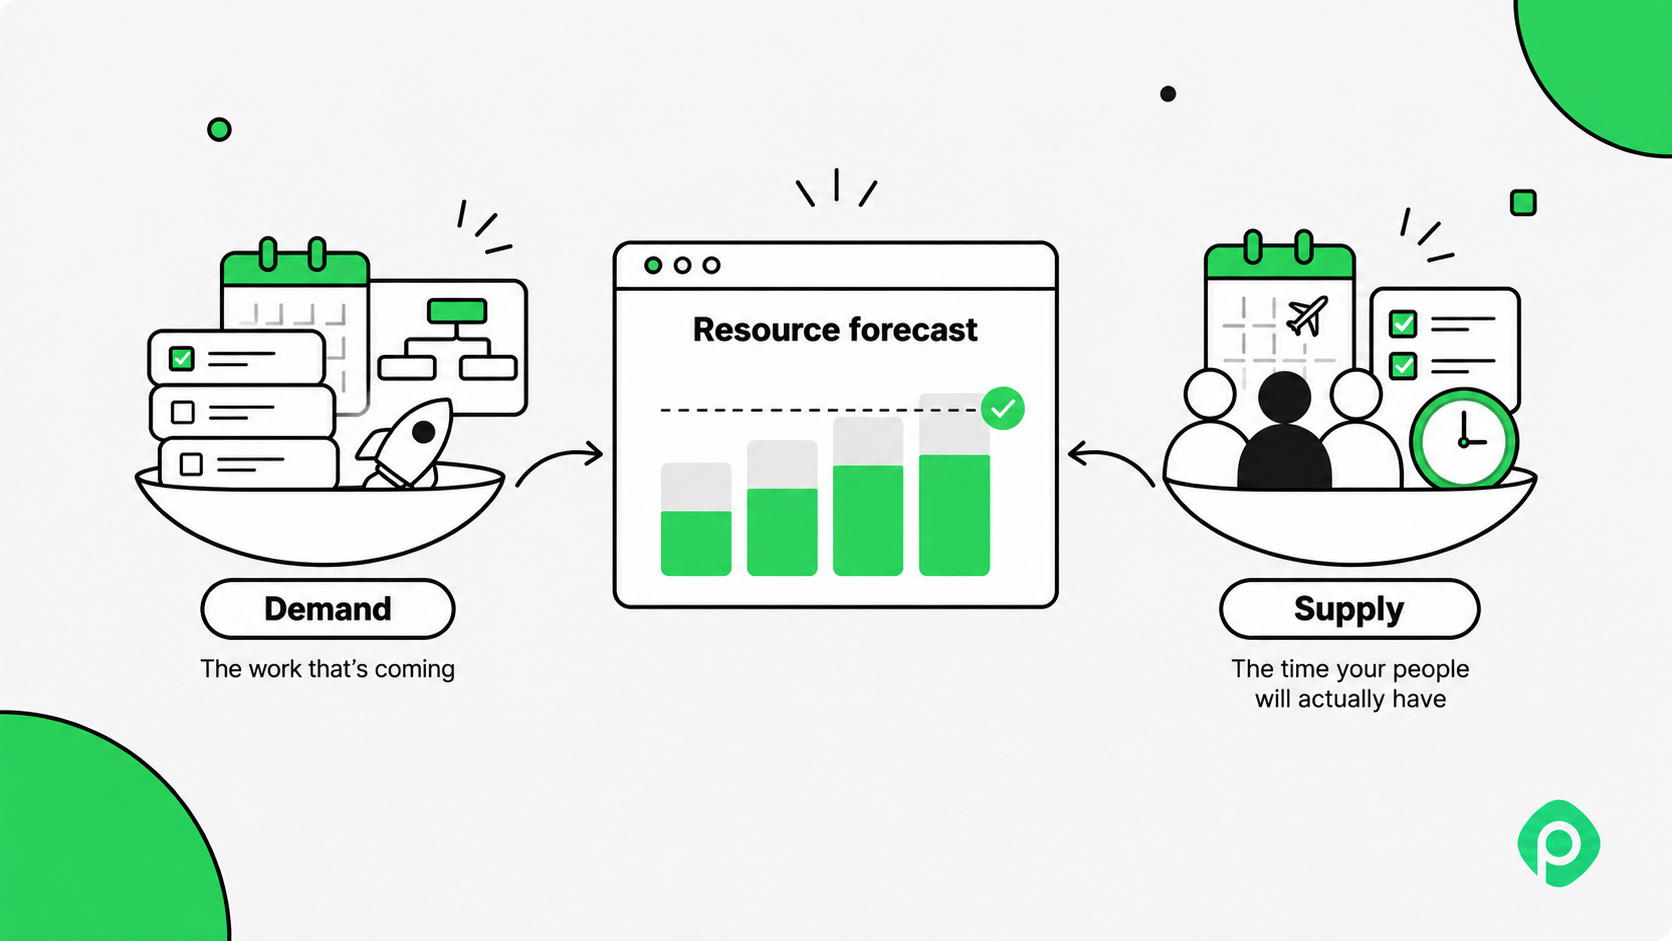
How to identify demand
Or better, how do we know what’s coming? Here are the things to look out for.
- Committed work. Roadmap items, signed projects, and releases already promised to someone.
- Probable work. Deals in the pipeline, proposals, and initiatives waiting for budget approval. They're uncertain, so they get weighted by how likely they are (more on that below).
- Recurring work nobody puts on the roadmap. Support tickets, bug fixing, maintenance, on-call, recurring meetings. This is the "keep the lights on" work, and it's the first thing people forget, even though it competes for the same hours as everything else.
How to identify supply
Supply may seem a little bit easier to forecast, but it’s important to keep several things in mind.
- People and their skills. And be very specific: instead of just “11 engineers” put "two backend developers, two QA engineers, one designer who knows the client's design system."
- Real working time. Working hours, part-time schedules, public holidays, planned vacations.
- Focus factor. An hour that is booked is not necessarily entirely productive. Interruptions, context switching, and meetings eat into every day, so plan on something like 80–85% of available time.
- Ramp-up time. A contractor who starts on January 6 isn't at full speed on January 6.
People aren't the only resource you can forecast, of course. Test devices, software licenses, and contractor budget can run out, too. They're usually easier to plan for, so we'll stick with the human resources here.
Resource forecasting methods (and when each one fits)
There are usually two families of resource forecasting methods.
- Qualitative methods lean on people's judgment, which is what you need when there's little or no history to go on.
- Quantitative methods lean on numbers, which work when the work repeats and you've been tracking it.
To be fair, most real forecasts use both: judgment for new work and data for recurring work. But let’s look at how both families work separately.
Qualitative methods
Expert input. Ask the people who know: tech leads for effort, sales for what's likely to close, product for what's coming on the roadmap.
Delphi technique. A more structured version of the same idea. Experts give estimates anonymously, see the group's results, and revise over several rounds until the numbers converge. It's a bit slower, so better use it when you have time and wrong guesses are too expensive.
Three-point estimating. Instead of one number, ask for three: optimistic (O), most likely (M), and pessimistic (P). Then take a weighted average:
E = \frac{O + 4M + P}{6}
The weighted estimate gives you a more balanced planning number than a single guess. The gap between O and P tells you how uncertain the work is before you’ve committed to anything.
Pipeline weighting. For work that may or may not happen, multiply the effort by the probability it goes ahead.
For example, a 400-hour project with a 60% chance of closing counts as 240 hours in the probability-weighted demand forecast. If the deal actually closes, though, you still need capacity for the full 400 hours.
Quantitative methods
Historical analogy. Look at how long similar past projects actually took and how many hours each role spent. If the last two integrations needed 30% more backend time than estimated, it’s already an insight.
Moving average. Average the last few periods to smooth out spikes. If backend support took 40, 55, and 70 hours over the last three months, the three-month average says 55 for next month.
Exponential smoothing. This one sounds intimidating for someone who enjoyed literature over math in school, but it really takes about a minute. Here’s the formula:
F_t = F_{t-1} + \alpha \left( A_{t-1} - F_{t-1} \right)
Here, F is the forecast, A is the actual, and α (alpha) is a smoothing constant between 0 and 1 that decides how hard you nudge. If it still sounds intimidating, let’s see an example.
Say you forecast 50 hours of backend support for October, and the team actually spent 70. With α = 0.3, your November forecast is 50 + 0.3 × (70 − 50) = 56 hours.
The only thing that may remain vague here is where on Earth we took the 0.3 alpha from. Here’s how to understand what your alpha is:
- Low alpha (0.1–0.3) when the work is fairly stable and a spike is probably a one-off.
- Higher alpha (0.5 and up) when resource demand is shifting.
- Alpha is when the next forecast simply equals the last actual value, with no smoothing.
Still, there's no correct alpha out of the box. Run a few values against your past months and keep the one with the smallest error.
Scenario modeling. Build a forecast for a few versions of the future (the deal is lost, the expected demand is probability-weighted, or the deal is won at full scope) and see which roles break in which case. It complements qualitative and quantitative methods rather than belonging exclusively to either group.
Which method to use when
In practice, combining different resource forecasting techniques usually produces the most useful result. But this table should help you differentiate between them.
| Forecasting method | Best for |
| Expert input | New work with little historical project data |
| Delphi technique | High-stakes decisions where estimates need consensus |
| Three-point estimating | Projects with uncertain effort or timelines |
| Pipeline weighting | Potential projects, deals, and proposals |
| Historical analogy | New projects similar to completed ones |
| Moving average | Recurring work with fluctuating demand |
| Exponential smoothing | Recurring work where recent results inform future demand |
| Scenario modeling | Planning around uncertain outcomes or major decisions |
How to build a resource forecast in 7 steps (a worked example)
Let’s say your manager catches you after a demo: "If we sign the Brightline integration deal, can the team start in January?"
Before answering, come join us in building the forecast that answers it.
1. Start with the decision
It's tempting to open a sheet and start listing everyone's hours. Don't, at least not yet. In our project tracking guide, we argued that every metric should come from a question you actually need answered. Same with the forecast.
So, suppose the question is: Can the team commit to Brightline in January? You need to know whether any role goes over available capacity in Q1, by how much, and early enough to fix it.
How far ahead you look also depends on your strategy: a team that keeps a bench (the Lead approach) can get away with a shorter horizon than a team that adds people only when demand arrives (Lag).
2. Collect future demand from the people who own it
Project managers aren’t oracles, any more than they are with dependencies. You probably don't know Brightline's odds, the roadmap's real size, or how long the integration will take. But other people may know, and your job is to gather their knowledge in one place:
- Sales: which deals are in the pipeline, when they'd start, and how likely they are.
- Product: what's already committed for Q1.
- Tech leads: effort per role for the new work.
- Your own data: how much time support and bug fixing have been eating.
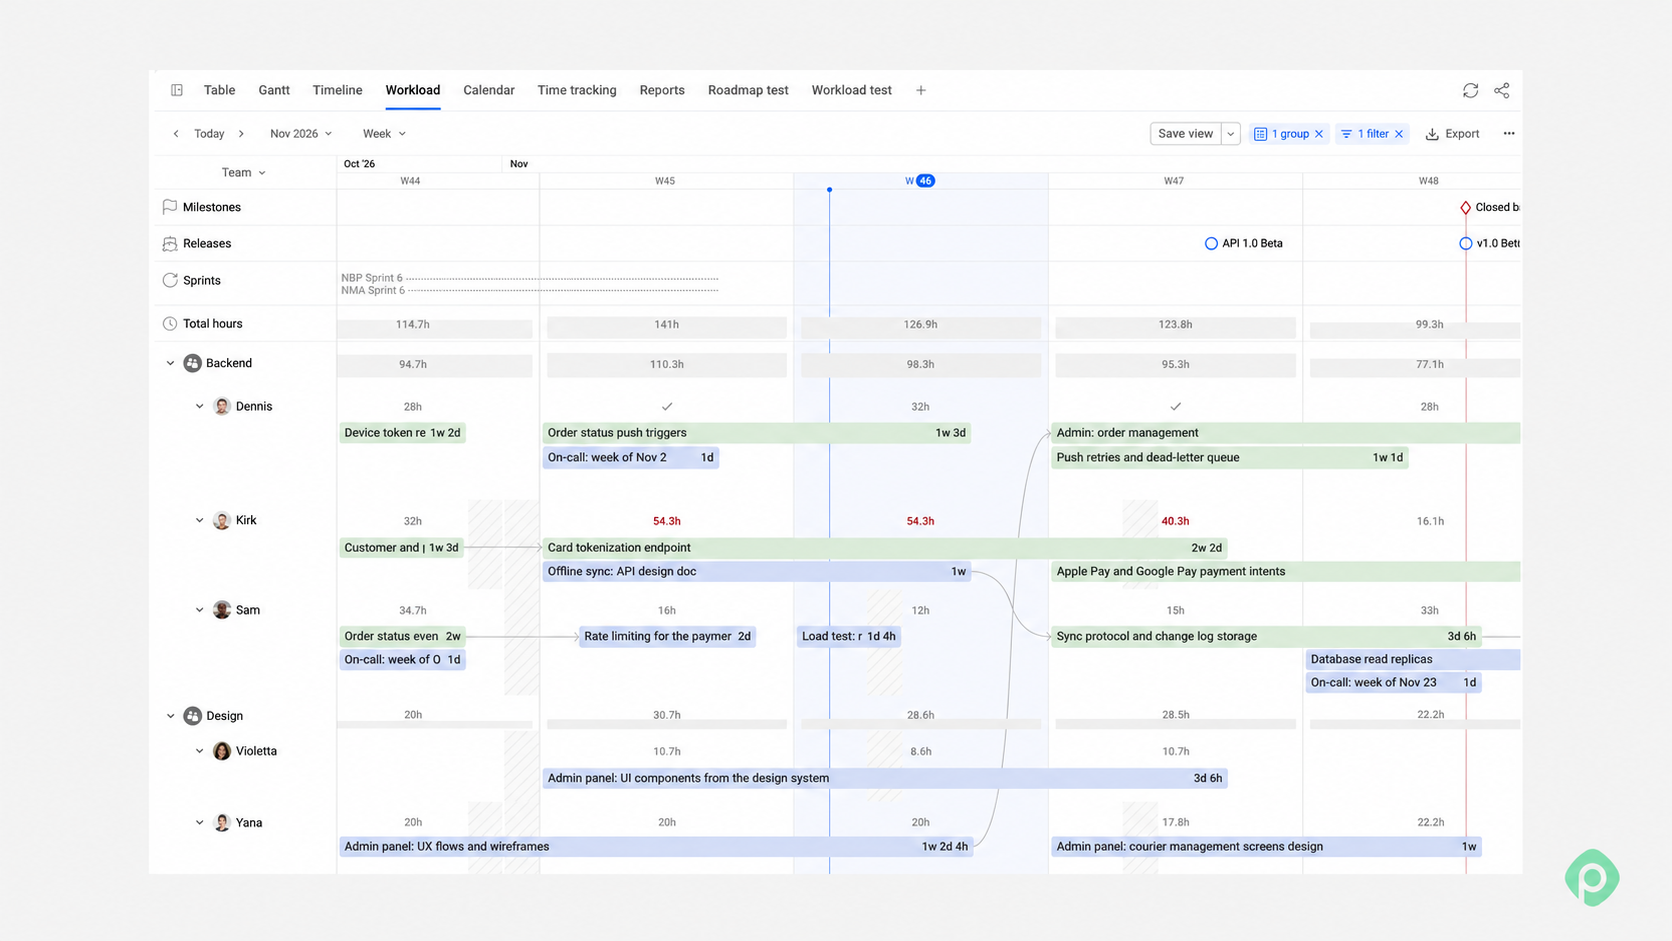
If your team works in Jira, Planyway for Jira, our all-in-one project planning app inside Jira, helps you turn those inputs into a resource plan. It brings work from multiple Jira spaces into one workspace, so you can review existing commitments across projects and check how much room is left for new work.
3. Estimate the effort in ranges
For Brightline, you ask the backend lead for three numbers instead of one: 300 hours if everything goes smoothly, 380 most likely, 580 if the client's API is as messy as their last one.
The three-point estimate comes out at (300 + 4 × 380 + 580) / 6 = 400 hours. Same with the other roles: 300 hours of design, 250 of QA, and 200 each for frontend and mobile.
Since the deal is 60% likely, each number goes into the forecast weighted: 240 hours for backend, 180 for design, 150 for QA, 120 each for frontend and mobile.
For recurring work, use the exponential smoothing forecast from earlier: 56 hours of backend support a month, or 168 for the quarter. Do the same for QA (60 hours for the quarter) and the frontend and mobile teams (45 each).
4. Work out real capacity
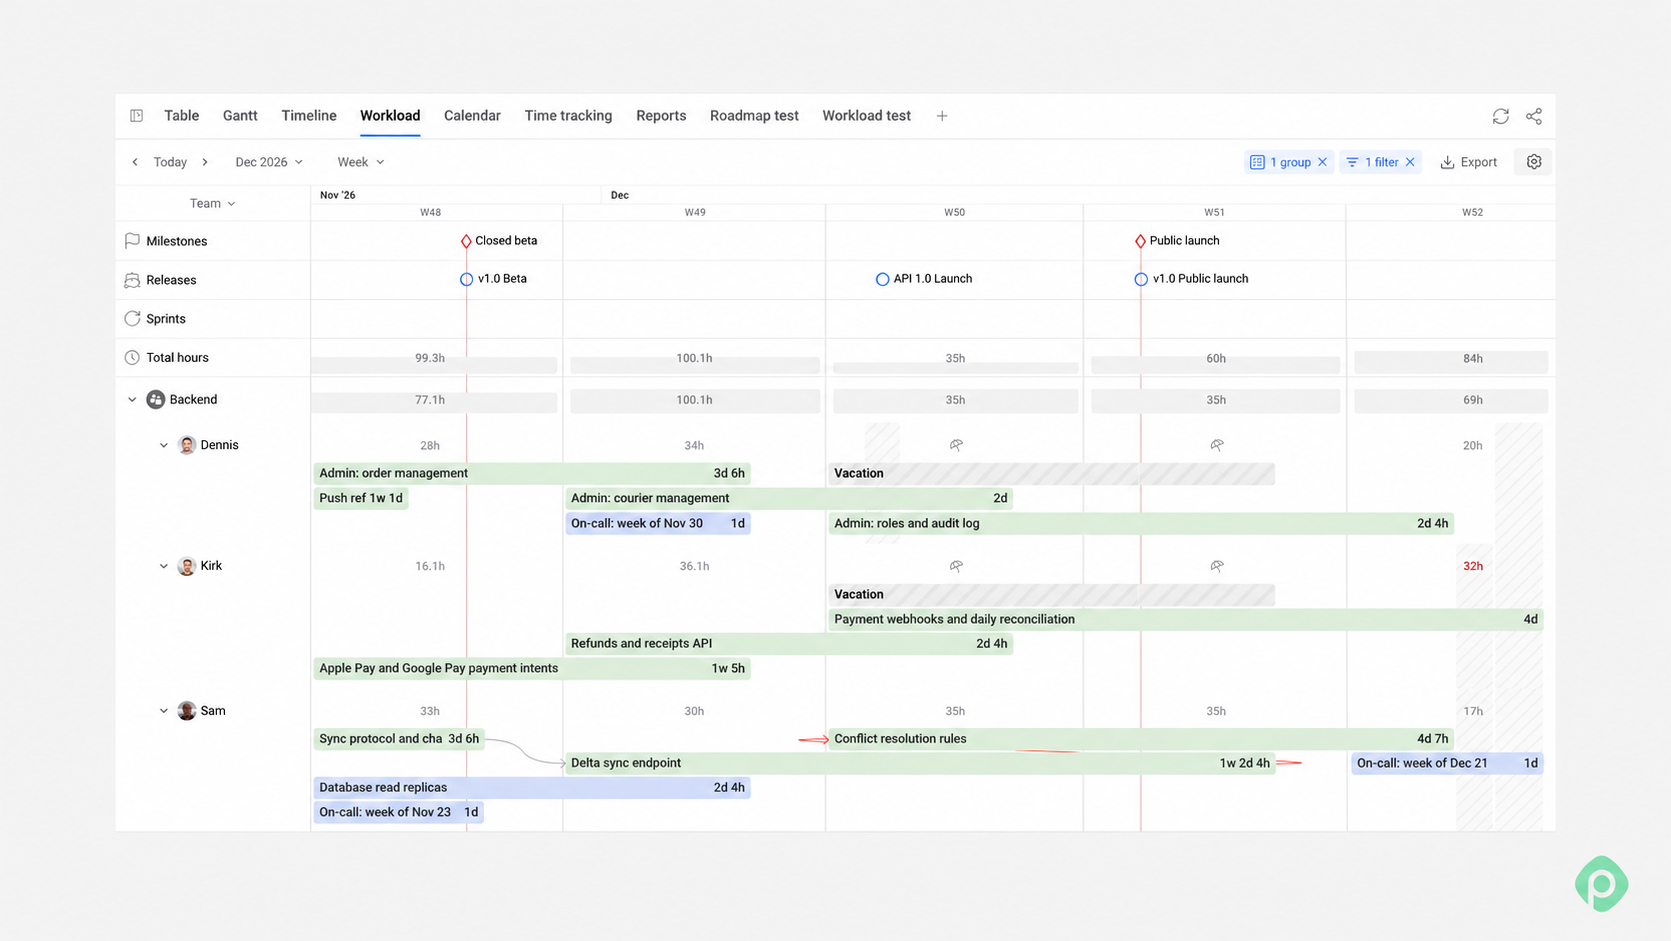
A quarter has 13 weeks, or 520 working hours per full-timer on paper. But from that, you’ll need to subtract five public holidays (more or less depending on the quarter) and an average of four vacation days (72 hours), which leaves 448.
Then apply an 85% focus factor for meetings, reviews, and the general friction of a workday. That leaves about 380 usable hours per person for Q1.
Booked hours aren't working hours, so a forecast shouldn’t assume 520 hours per person or else it’s wrong from the start.
The 85% focus factor in this example is an additional planning assumption. Account for meetings and other overhead consistently, either as scheduled work or as a capacity allowance, so the same hours aren’t deducted twice.
5. Compare demand and capacity by role, not in total
Here's the team's Q1 forecast with Brightline weighted at 60%:
| Role | People | Usable capacity, h | Committed, h | Support and bugs, h | Brightline (60%), h | Forecast load |
| Backend | 2 | 760 | 500 | 168 | 240 | 119% |
| Design | 1 | 380 | 200 | 0 | 180 | 100% |
| QA | 2 | 760 | 520 | 60 | 150 | 96% |
| Frontend | 3 | 1,140 | 800 | 45 | 120 | 85% |
| Mobile | 3 | 1,140 | 800 | 45 | 120 | 85% |
| Whole team | 11 | 4,180 | 2,820 | 318 | 810 | 94% |
At 94% in the bottom row, the team looks busy but fine. This is a good plan if you forecast in total headcount. But if you look at the top two rows, you’ll start to see the problem. Backend is at 119%, about 150 hours short, or roughly 0.4 of a person for the quarter.
Moreover, the designer is at exactly 100%. It may sound fine until you remember she's the only designer who knows this client's product and design system. What will you do if she suddenly takes a sick week? As we wrote in our tracking guide, a comfortable team average can sit right on top of a badly skewed distribution.
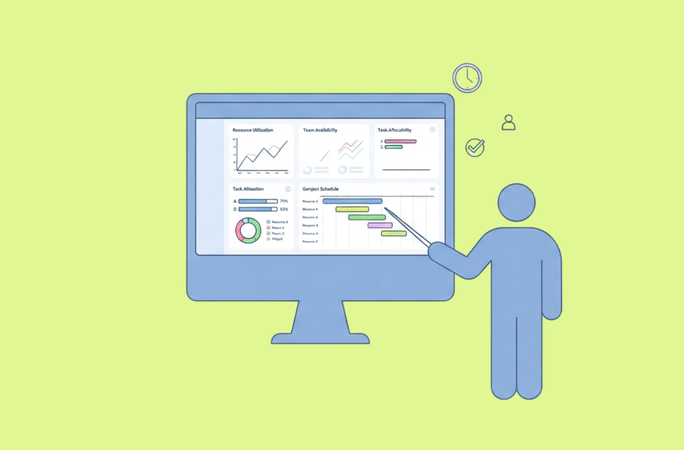
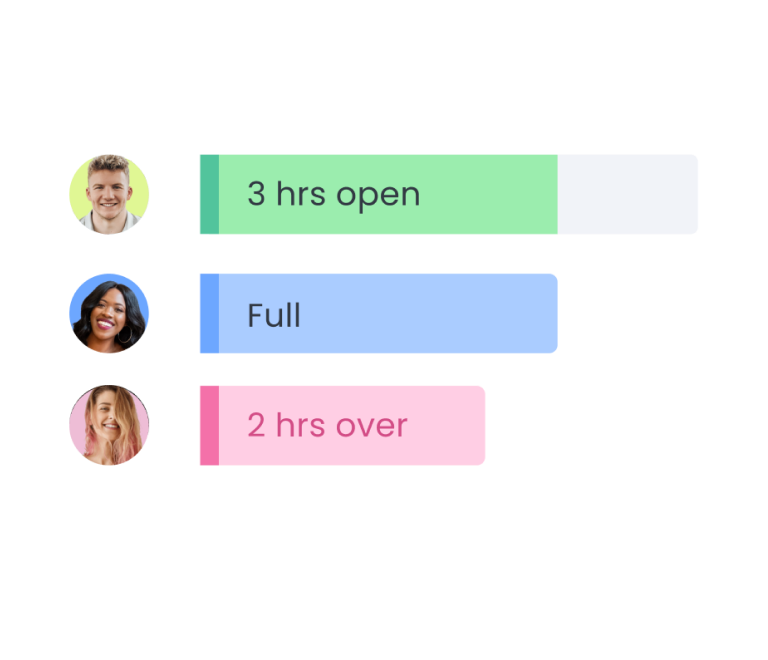
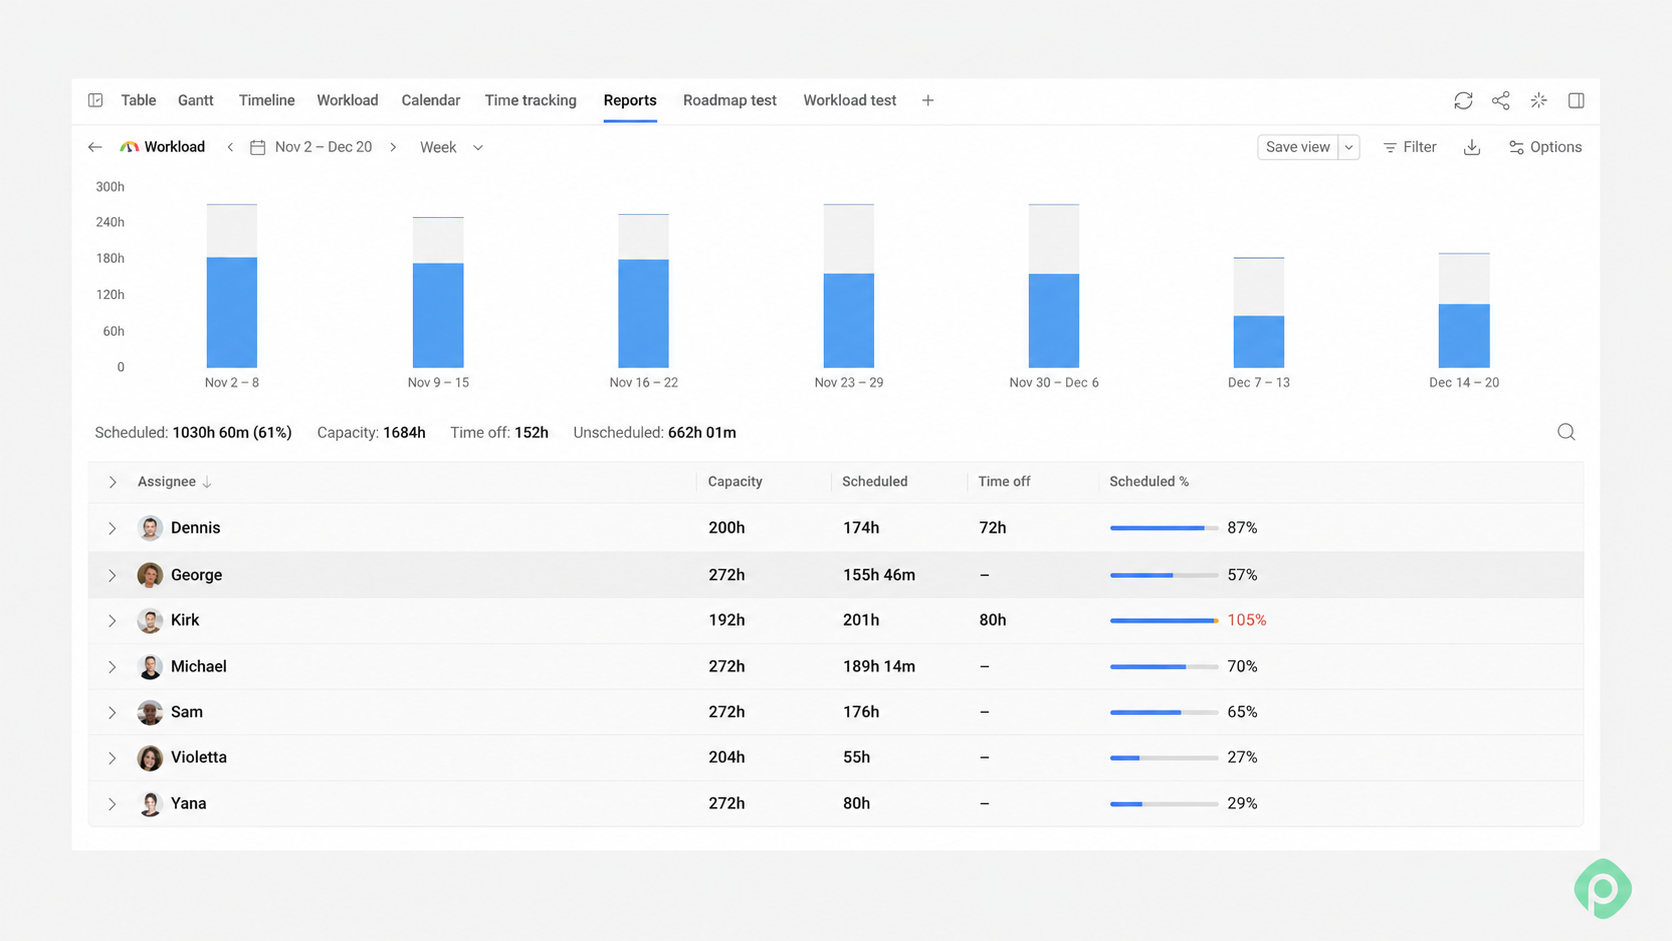
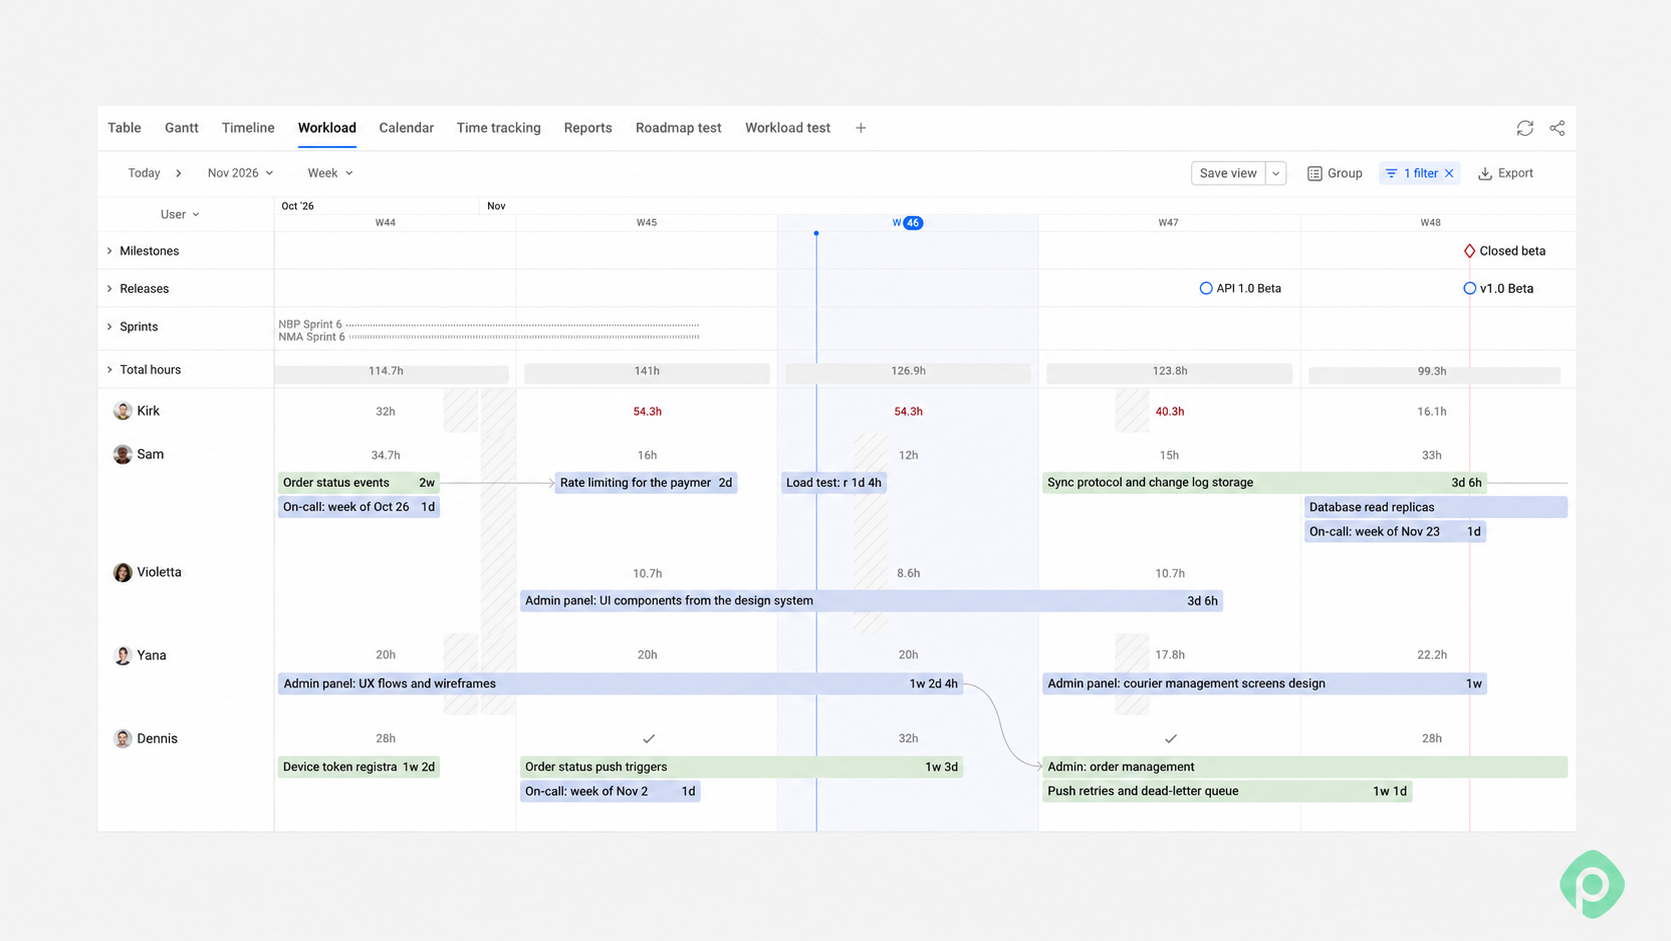
If you work in Jira, Planyway’s Workload report helps you make the same comparison: scheduled hours against available capacity, with a workload percentage for each person so you can spot overload behind a comfortable team average.
6. Run a few scenarios
Check the two roles that are at risk under each outcome (if the deal closes, or if it won’t):
| Scenario | Backend load | Design load | What it means |
| Deal lost | 88% | 53% | Comfortable. The designer has room for the backlog. |
| Weighted (60%) | 119% | 100% | Backend short by ~150 h, no slack in design. |
| Deal won, full scope | 141% | 132% | Backend short by ~310 h, design short by ~120 h. |
We have an answer for you manager! And it’s an actionable one: "Yes, we can start Brightline in January, if we approve a backend contractor at about half-time by early November, and if the client accepts the redesign starting in February instead of January."
When dates do shift, the forecast has to shift with them. If Brightline's design work slides to February, everything waiting on it moves too because of dependencies.
Planyway displays Jira dependencies as arrows in Gantt, Timeline, and Workload views. With Dependency Auto-move enabled, rescheduling a predecessor can also move dependent tasks. Recheck workloads after the dates change.
7. Revisit the forecast and calibrate it
The worst thing even about the best forecast is that it starts aging the moment it’s finished, which is why you need to constantly review it. A good rhythm is once a month for the quarter-level view and every sprint for the next few weeks.
You can do it the way you want, but we usually prefer asking three questions:
- What changed? Were there new deals, cancelled work, someone leaving, a vacation added?
- How far off were we? Compare last month's forecast with what actually happened, role by role.
- What do we adjust? If support keeps landing above forecast, raise alpha. If the team keeps underestimating new work by 20%, build that 20% into the next estimate.
Estimation accuracy is one of the most useful a team has, but few teams actually end up tracking it.
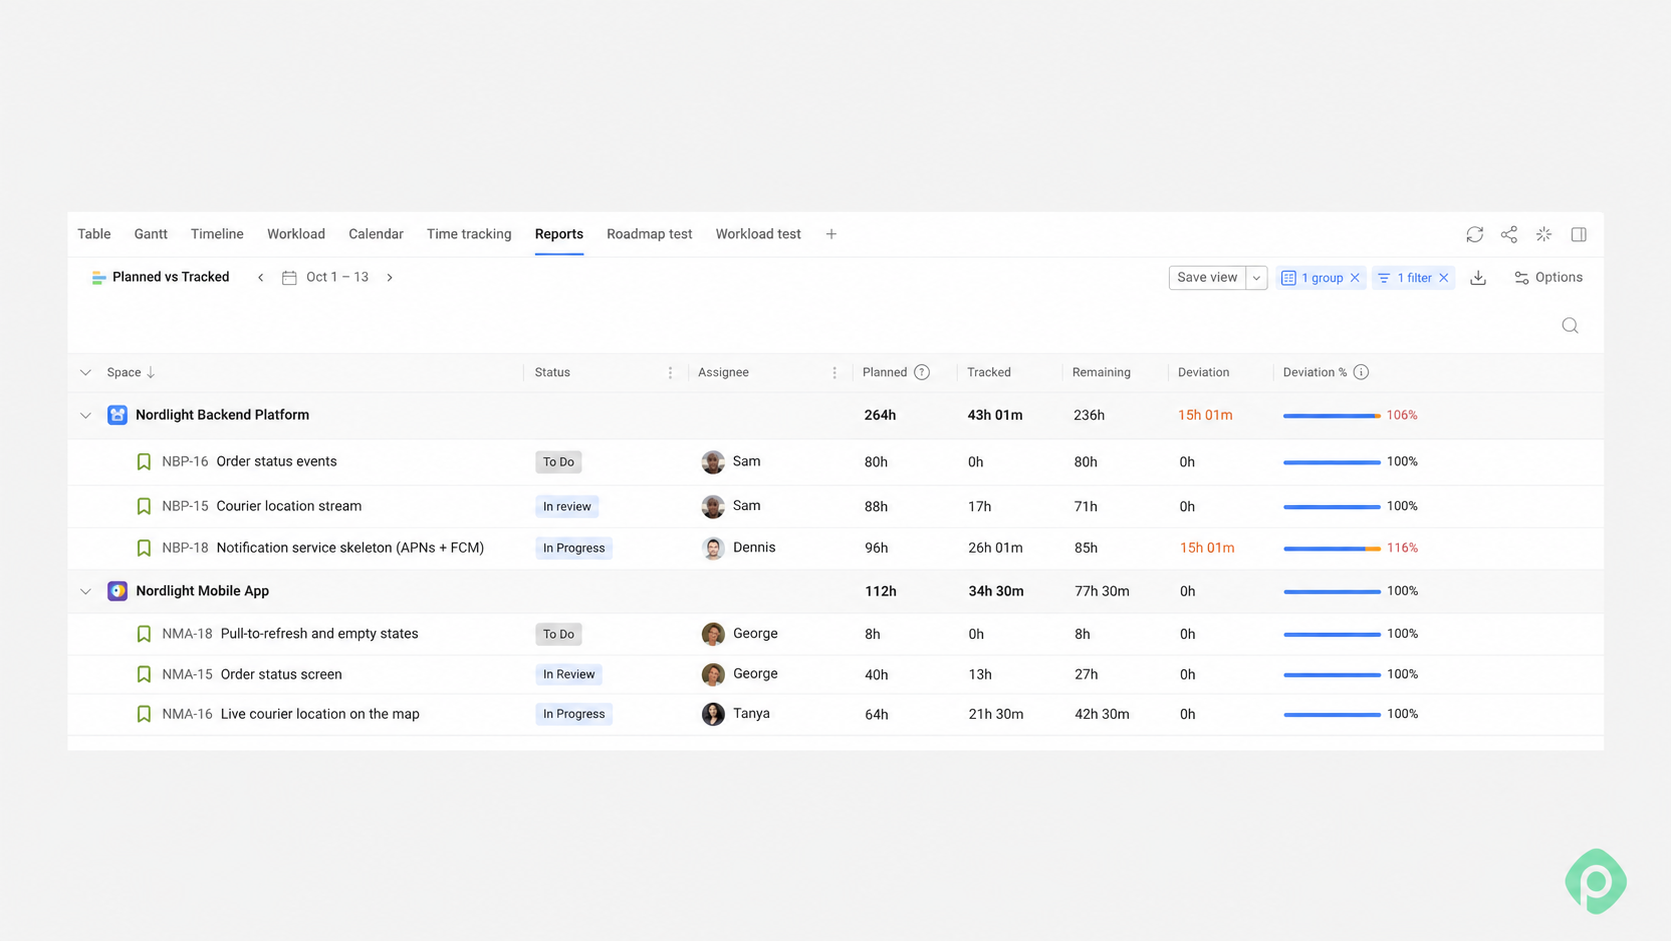
Planyway’s Planned vs. Tracked report compares estimated hours with logged time and remaining effort. Include remaining time in the deviation calculation to spot likely overruns before tasks are finished. For completed work, compare planned and tracked hours to improve future estimates. Time logged in Planyway is recorded against Jira work items.
Finally, keep the plan where your manager can see it. Save a configured Planyway view and share its link with stakeholders who have the necessary Jira permissions. For people without Jira access, use an appropriate export, such as a PDF of the planning view.
Can you do resource forecasting in a spreadsheet?
Yes, and it’s a perfectly good place to start for a small team. Here’s how you can compose a simple forecasting sheet:
- Months across the top, as far out as your horizon (12–18 months will do).
- One row per person per project, with name, role, and project columns you can filter on.
- A "non-working time" row for part-time schedules and vacations, so each person's total should add up to 100%.
- A totals row using SUBTOTAL instead of SUM, so when you filter to one person, you see only their load.
- A separate dashboard tab with one row per person and a SUMIFS formula pulling their total allocation per month from the data tab.
- Conditional formatting with a color scale on the dashboard. You can use red for over 100%, and green for under.
➡️ If you'd rather not build it from scratch, our capacity planning templates include ready-made versions, from a quick team calculator to long-range planning.
However, the sheet starts to struggle when:
- people work across several projects, and every PM keeps their own copy;
- plans change weekly, and updating the sheet turns into a second job;
- the real work lives in Jira, so the sheet is always a few days behind it;
- you want to compare the forecast with what actually happened, which a sheet can't do without someone copying actuals in by hand.
What to look for in resource forecasting tools
When you do decide to switch from spreadsheets to some kind of resource management software, here's what actually matters in a tool:
- Room for work that doesn't exist yet such as tentative projects, placeholder roles, or maybe-deals you can add without pretending they're confirmed.
- Capacity built from real working time: working hours, holidays, vacations, part-time schedules.
- Views by role and team so you can forecast months ahead without naming every assignee.
- Scenarios, or at least an easy way to compare "with the deal" and "without it."
- Planned vs. actual data, so the forecast can be calibrated against reality.
- A cross-project view, because the person who's overloaded is usually overloaded across multiple projects.
- A way to share it with people who'll never open the tool themselves.
Various tools cover these in different ways:
| Tool type | Examples | Good for |
| Resource scheduling tools | Float, Resource Guru | Agencies and service teams scheduling people across client projects |
| Portfolio management (PPM) | PDWare ResourceFirst, Planview | Large organizations forecasting demand across a whole portfolio |
| Professional services automation (PSA) | Upland PSA, Kantata | Service firms that need forecasts tied to billing and margins |
| Work management platforms | monday.com, Wrike | Teams that run their projects in that platform already |
| Jira apps | Planyway for Jira | Teams whose work already lives in Jira and who want forecasts built from the same issues, estimates, and logged time |
The best choice is usually the one closest to where your work already lives.
6 resource forecasting mistakes we see most often
When we talk to Jira teams about what goes wrong in their resource forecasting process, the same handful of problems keep coming up.
- Forecasting headcount instead of skills — Gaps almost always open in one role first, usually the one with the fewest people in it.
- Treating booked hours as working hours — A forecast that gives everyone 40 productive hours a week is way too optimistic. As weird as it sounds, a 40-hour task is highly unlikely to be done by 2 people with 20 hours.
- Leaving support and maintenance out — Bug fixing and support usually hurt the project progress in every sprint without revealing themselves in the roadmap. If you don't forecast them, they'll eat the hours you planned for something else.
- Giving one number instead of a range — Ranges are more honest, and it tells stakeholders how much risk they're signing up for.
- Forecasting only confirmed work — By the time a deal is signed, it's often too late to hire for it. Weighted pipeline work belongs in the forecast, clearly marked as tentative.
- Forecast with no owner — Ownership is important, even in predictions. Give your forecast an owner and a review rhythm. It also helps when the people who own the work (PMs) and the people who own the people (team leads, functional managers) agree on the same numbers.
Best forecasts leave room for reality
Instead of predicting the future perfectly (which isn’t possible), treat resource forecasting as seeing what’s coming and starting preparation for it early. When you combine expert input, historical resource data, realistic resource capacity estimates, and scenario planning, you can make better decisions about upcoming projects without relying on guesswork.
Forecast by role and skill, keep time offs and holidays in mind, weigh real capacity in, and most importantly, keep revisiting and readjusting project priorities. This will give you enough visibility to act before a resource gap surprises you with a missed deadline or a burnout.
Planyway for Jira helps you put those decisions into practice: plan work across projects, review scheduled effort against team capacity, and use tracked time to improve the next forecast.


FAQ
There’s no single best tool — it depends on how your team works. The right choice usually comes down to whether you want to track right in your system or in a standalone tool, how you model capacity, whether you need scenario planning, and how you compare estimates with tracked time. Tools like Planyway for Jira, Float, and Resource Guru all help forecast workloads, manage availability, and plan resources across projects, but they fit different workflows: Planyway is strongest if your work already lives in Jira (it also brings time and resources together), while Float and Resource Guru are more standalone resource planning tools.
Yes, but it depends on your Jira plan and how deep you need to go.
Jira has built-in capacity planning (the Capacity view), but it’s only available on Premium and Enterprise plans, and it uses a fixed 40-hour week as a baseline. It’s good for sprint-level team capacity, but less suited for role-level forecasting or detailed availability management.
For more advanced resource management on any Jira plan, teams use apps like Planyway for Jira. It adds cross-project workload views, utilization reports, and planned vs. tracked time — and it’s free for teams of up to 10 users, with paid plans starting at around $3 per user. So Jira can absolutely be used for resource management, but the right setup depends on whether you stay native or extend it with an app.
Start with the decision you need to answer, then collect upcoming committed and potential work from the people who own it — sales, product, tech leads, and your own support data. Estimate effort by role in ranges, calculate real capacity after holidays, vacations, and focus time, and compare demand with availability by role rather than in total. Then model a few scenarios, such as deal won vs. deal lost, and update the forecast regularly as priorities, dates, and resources change.
Resource forecasting looks ahead and predicts what future work will need — usually by role and in rough hours, before you know exactly who will do it. Resource planning works with the present and turns that forecast into specific assignments: who does what, when, and at what level of load. Forecasting helps you decide whether you need more people or can take on more work; planning helps you allocate the people you already have.
At least as far ahead as your slowest fix takes. If hiring takes three months, a six-week forecast won’t help you make hiring decisions in time. Many teams use a two-level rhythm: forecast one or two quarters ahead at the role level, and the next few weeks at the person level. Then revisit the quarter-level view monthly and the near-term view every sprint.