Project tracker template: steal the process, not the spreadsheet

Usually, articles about project tracking start with a list of things to measure. But we’ll start somewhere else: with the idea that tracking isn't a checklist. It's a process — and the tool or project tracking template you pick should come out of that process, not the other way around.
We'll walk through what tracking actually means, how to figure out which metrics matter for your specific project instead of copying someone else's list, a few underused metrics worth adding to your rotation, as well as how task lists, trackers, and full-fledged project management tools actually differ.
TL;DR
- Effective project tracking boils down to actively sourcing, reviewing, and analyzing data about what's happening on your project and what affects it — not a one-time dashboard setup.
- For project progress tracking, avoid starting from a list of metrics. Start from your project goals, turn them into questions, then derive metrics from those questions (the GQM method). This way, every metric serves a purpose rather than being tracked out of habit.
- A few underused metrics worth adding to the project tracking process include estimation accuracy, cycle time per estimation group, created vs. resolved, and workload distribution vs. capacity.
What is project tracking?
Project tracking is a process of actively sourcing, reviewing, and analyzing data about the project and parameters that indicate or impact project performance.
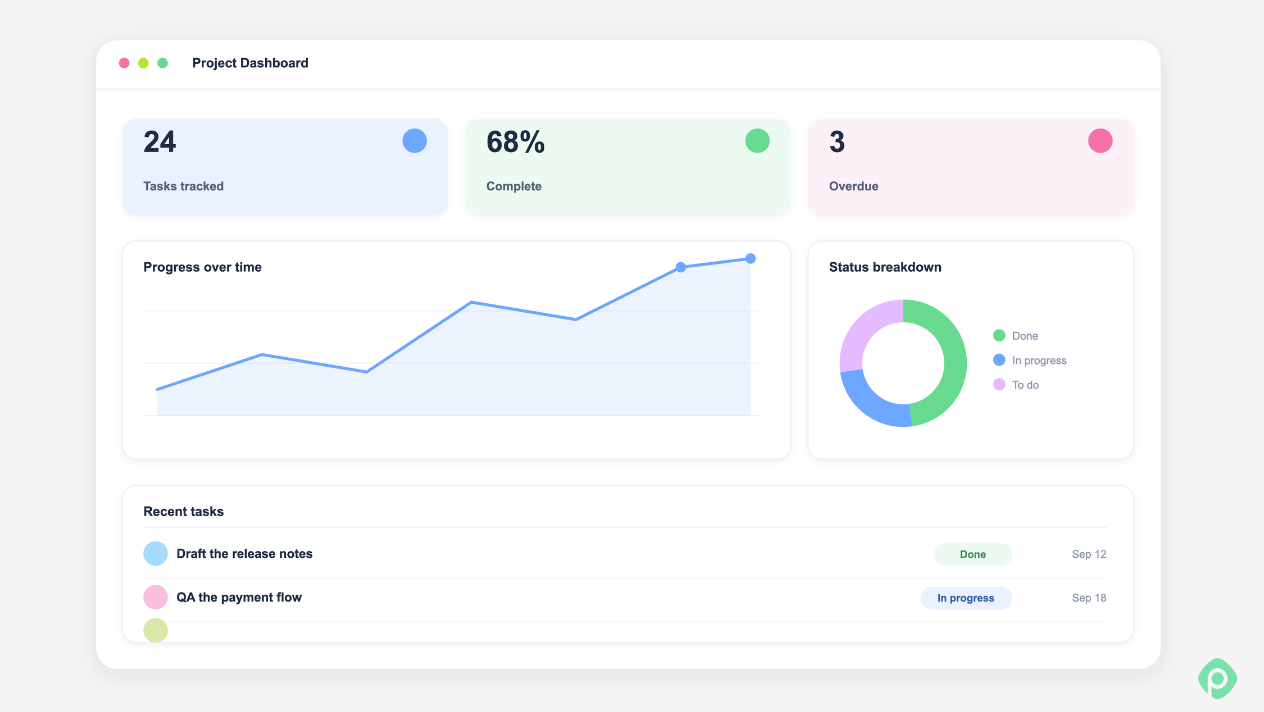
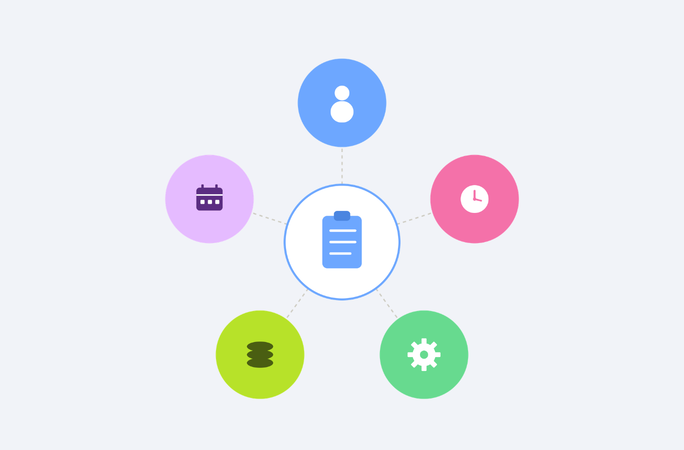
If we dissect this definition, we'll see that it spans all the things that a project manager is supposed to do throughout the project lifecycle to track the entire project properly, including:
- identifying parameters that impact the project;
- understanding which data/metrics give the most useful information on said parameters;
- sourcing the data — task statuses, task progress, project updates, and other project information;
- reviewing the data and making it visible to others (e.g., in regular project status reports) to keep stakeholders informed and the entire team on the same page;
- analyzing the obtained data to derive actionable insights from it.
This maps closely to what PMI calls the Monitoring and Controlling process group. In this article, we'll go a step further and look at project trackers and why your process should dictate the tracker you use, not the other way around.
A note on reporting:
In our previous piece on executive reporting, we touched upon the topic of what constitutes an executive report. One of the core functions of reports is monitoring and controlling the state of the project/organisation/initiative. The report in this case is used to track the state of the organisation, and reporting is one way of tracking things happening on projects.
But first, let’s take a look at how to identify the metrics that serve your purposes best.
How to identify the project tracking metrics that actually matter in 3 steps
Metric selection for any project usually depends on:
- project type/methodology,
- who's consuming the data (exec vs. team),
- and (c) what's actually at risk on that particular project.
A simple framework like "ask what could actually derail this project, then track the metric that would show it early" tends to be more actionable than "pick metrics aligned to your goals".
1. Start with the ideal: the Ideal Final Result
Before selecting metrics, it helps to imagine the ideal version of tracking itself. From experience, the best method to identify the relevant metrics is to paint a picture of the ideal process that you want to eventually achieve with as many details as possible.
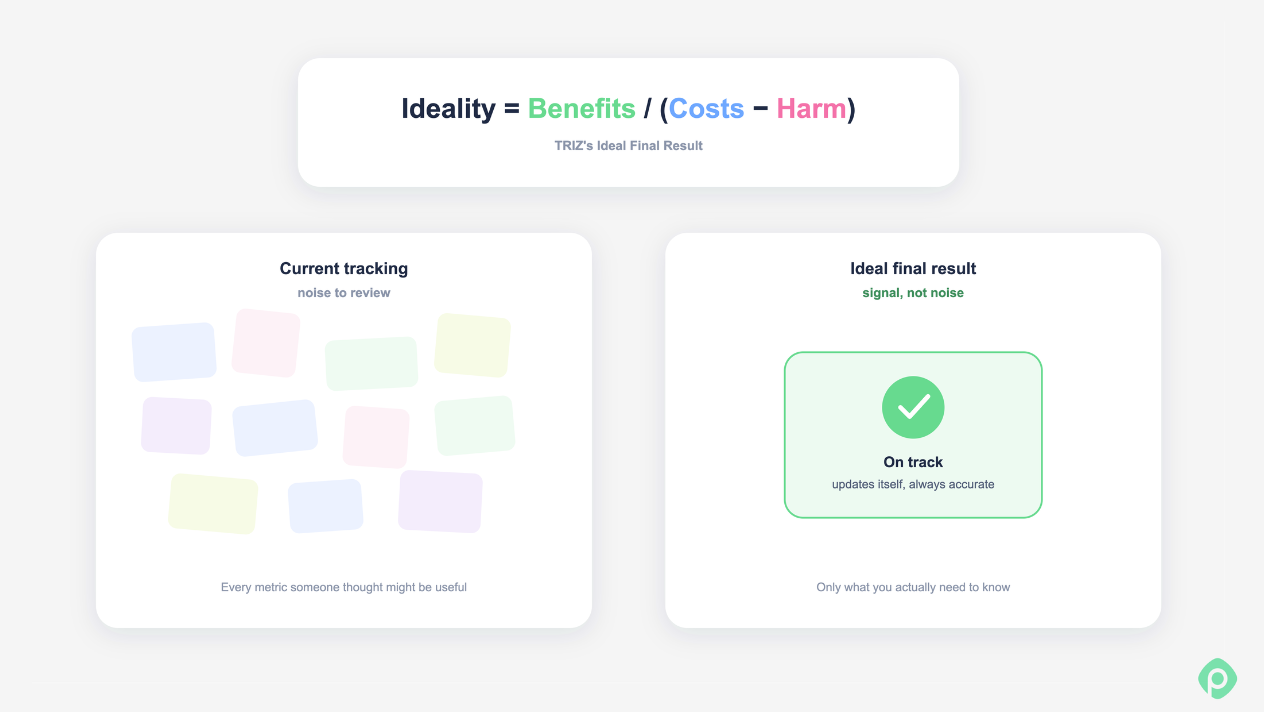
TRIZ, a problem-solving framework originally built for engineering, has a concept called the Ideal Final Result (IFR). According to it, instead of asking "How do we solve this," you should first ask "What would the perfect outcome look like, with none of the current constraints?"
Applied to tracking, the ideal result isn't a bigger dashboard — it's project data that collects itself, is always accurate, and tells you only what you actually need to know. Every metric you add should be judged against that: does it move you closer to that ideal, or is it just more noise to review?
That's the mindset that the project manager should have.
2. Build the list with Goal-Question-Metric (GQM)
To generate the list of metrics, a more structured method works better: Goal-Question-Metric (GQM), developed in software engineering. It's still one of the most reliable ways to derive metrics that connect to something real. It works in three steps:
- Start with a goal. A concrete goal, ideally SMART-defined, with as much detail as you can add at this stage. While it seems like overkill to pin down details before the project is even underway, a clear goal is what gives you direction and lets you lead the team through uncertainty. "Track the project" doesn't cut it — you're looking for something more specific, like "ship v2.0 by March 15."
- Turn the goal into questions. What would you need to know to tell if you're on track? For a project schedule goal, that's not just "Are we ahead or behind?" — you need sharper questions, like: What would signal that we're trending worse or better toward the deadline? What level of (im)precision is acceptable in the current circumstances?
- Derive metrics from the questions. Each question points to a specific, measurable answer, such as schedule variance, milestone completion rate, or overdue task count. For example, if you ask yourself, "How do I know we'll be late if nothing changes?", you can land on the Schedule Performance Index as your metric.
The advantage over just picking metrics from a list (like the ones later in this article) is that every metric earns its place — it exists because a real question needs it, not because it's common in your methodology.
A few common goals and the questions/metrics they lead to:
| Goal | Question | Metrics |
| Ship on time | Are we ahead or behind? | Schedule variance, milestone completion |
| Keep the team sustainable | Is anyone overloaded? | Planned workload vs. capacity, utilization |
| Stay on budget | Are we spending faster than planned? | Cost variance, budget remaining |
| Maximum predictability | Are we meeting our estimates? | Estimate variance, created vs. resolved |
3. Refine your project tracking metric list
After you've drawn up a first draft of the metrics you plan to track, you'll usually run into three typical doubts or problems:
- Want your metrics aligned with other teams or a wider org? That's a Delphi-style problem — get input from stakeholders across teams, iterate anonymously until you converge on a shared set. Useful once you're standardizing across a PMO or multiple projects, not something a single team needs to formalize.
- Not sure if the metrics you picked are actually useful, or just habitual? Score each candidate against a short set of criteria — how costly is it to collect, how directly does it answer your GQM question, how likely is someone to act on it. That's a lightweight version of multi-criteria decision analysis (MCDA), and it's a good sanity check before you commit to tracking something long-term.
- Metrics look fine on paper but don't seem to predict outcomes? That's where statistical approaches come in — looking at your historical data to see which metrics actually correlate with the outcomes you care about, and dropping the ones that don't. This needs a decent amount of historical data to be worth doing, so it's more relevant once you've been tracking for a while.
Beyond the goal-driven metrics above, a few specific ones are worth calling out on their own — they're not the most popular, but will tell you more per metric than most.
4 underused metrics for project progress tracking
Some project parameters tell you more than others, and improving them pays off on several fronts at once, not just on that one number. Here are the metrics that fall into this category.
Estimation accuracy
This metric shows whether your team overestimates or underestimates, by how much, and how that trend changes over a given period. How you track it depends on how you estimate.
- For Story Point estimations, you can estimate tasks before they are worked on and then re-estimate after they are done. Then you calculate the difference and look for trends over time. Yes, it’s extra work for the team, but quite often it’s worth it.
- If you estimate in hours, you can simply track the delta between the estimation and the cycle time for a particular task. Important: use specifically the cycle time, NOT the time the employee logged via a time tracking tool, although it may have its own uses. The delta here isn't just estimation error; it also captures the real-world friction the estimate didn't account for.
What is estimation accuracy useful for?
Simply put, it keeps things very real and highlights important symptoms early.
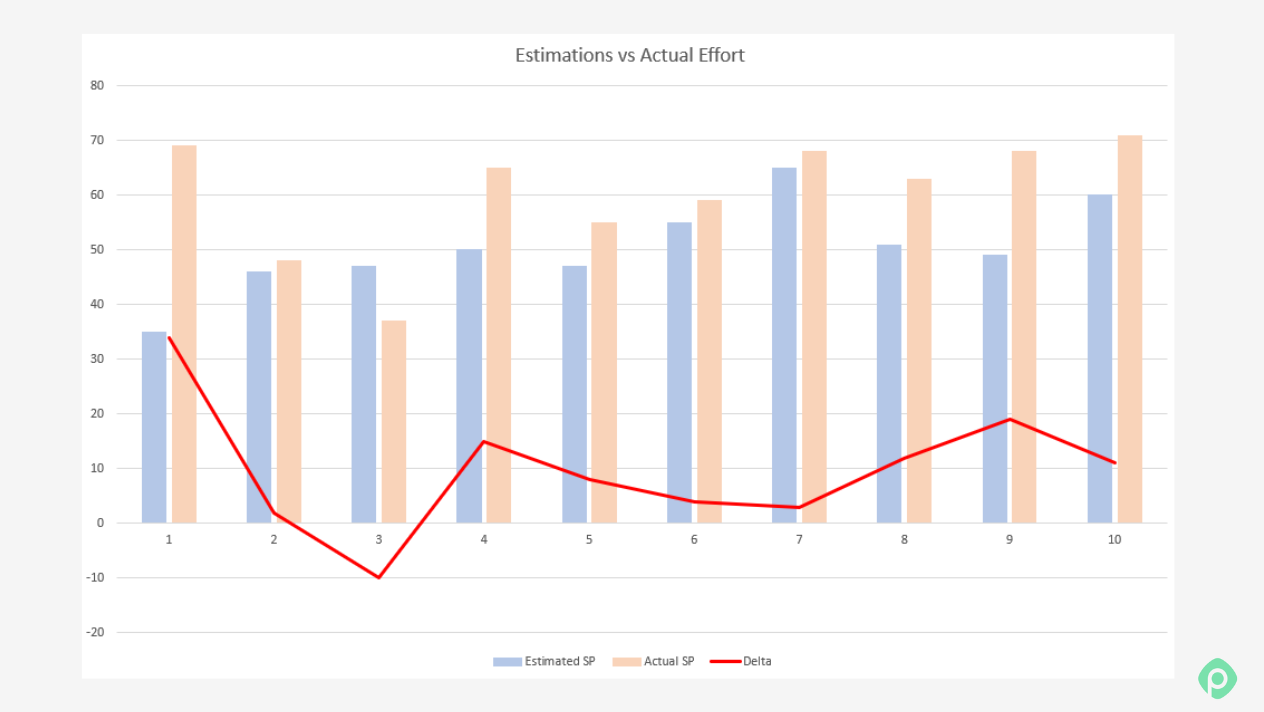
Inaccurate estimations can be a symptom of many different things. On the chart above, you can see that the team almost consistently underestimates the tasks. The reason for it can be poorly conducted planning, poorly described tickets, random dependencies, the bureaucracy that the team stumbles upon, and so on. Whatever the cause, it's worth bringing it up at the team's next retrospective and digging into it with the team.
Some mismatch between logged and estimated hours is normal early in a project. Toward the end, though, underestimation should disappear as the project becomes better understood. If the gap isn't shrinking over time, that's a sign of potential problems.
Cycle time per estimation group
Split your estimates into groups and calculate the average cycle time for each one. If you estimate in Story Points, your Fibonacci values (1, 2, 3, 5, 8, and so on) already give you ready-made groups. The same approach works for hour-based estimates: you can get your hours scored against each ticket, then track the Cycle Time for each estimation.
What is this project tracking metric useful for?
The purpose of keeping tabs on the cycle time is simple: to see the actual time your team spends on short tasks and how much more uncertainty big tasks have, which can be a good indication of the project’s complexity. The flatter the line for each SP group, the more predictable your flow and the smoother your process. Simply put, a good trend is a line that's smooth and trending down.
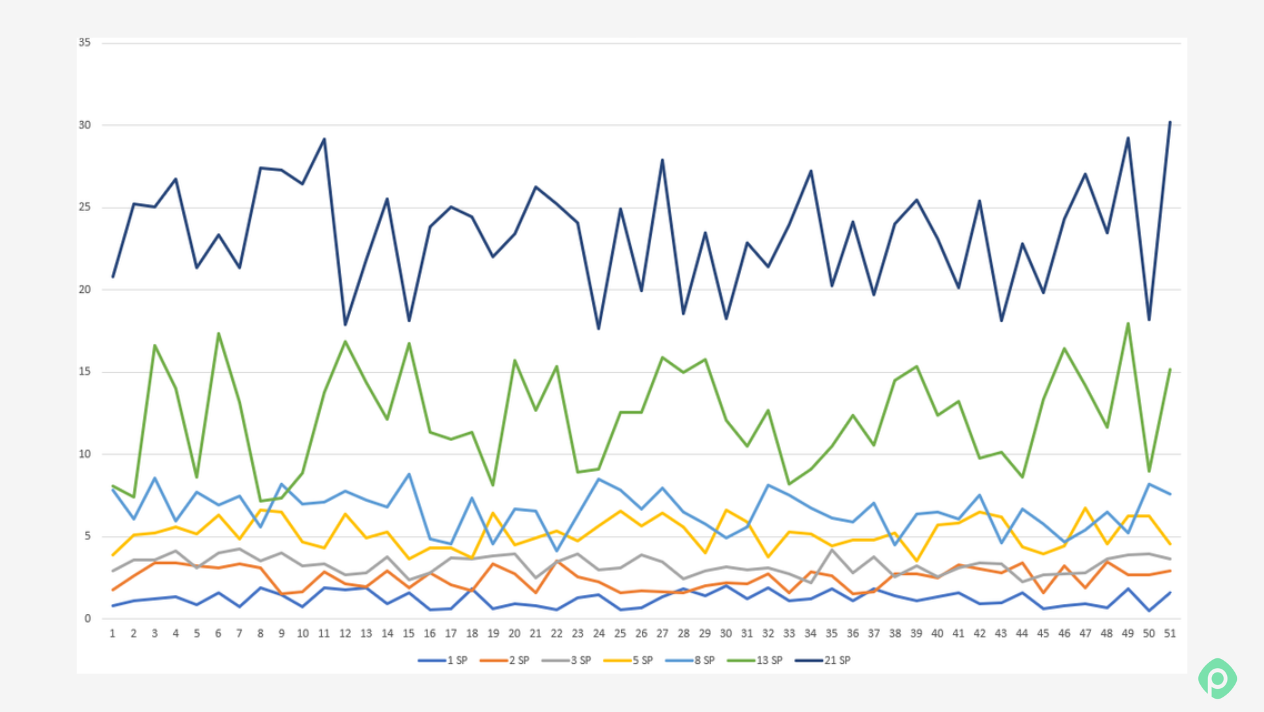
In the image above, two things stand out. First, the lower-SP lines (1, 2, 3, 5, 8) should ideally form clean, separated bands if estimation is precise — instead, they drift into and overlap each other's range, which suggests the team isn't reliably distinguishing task sizes at estimation time. Second, the 21 SP line shows up almost every sprint, which is unusual — that size is typically rare, so this consistency can point to poor task breakdown upstream.
P.S. You can use lead time instead of cycle time, but this requires tighter collaboration with product management.
Created vs Resolved
This metric is all about flow: how steadily work comes in and how well the team keeps up with it. Your Created vs Resolved chart should ideally show that you have as many created issues as resolved for a period of time.
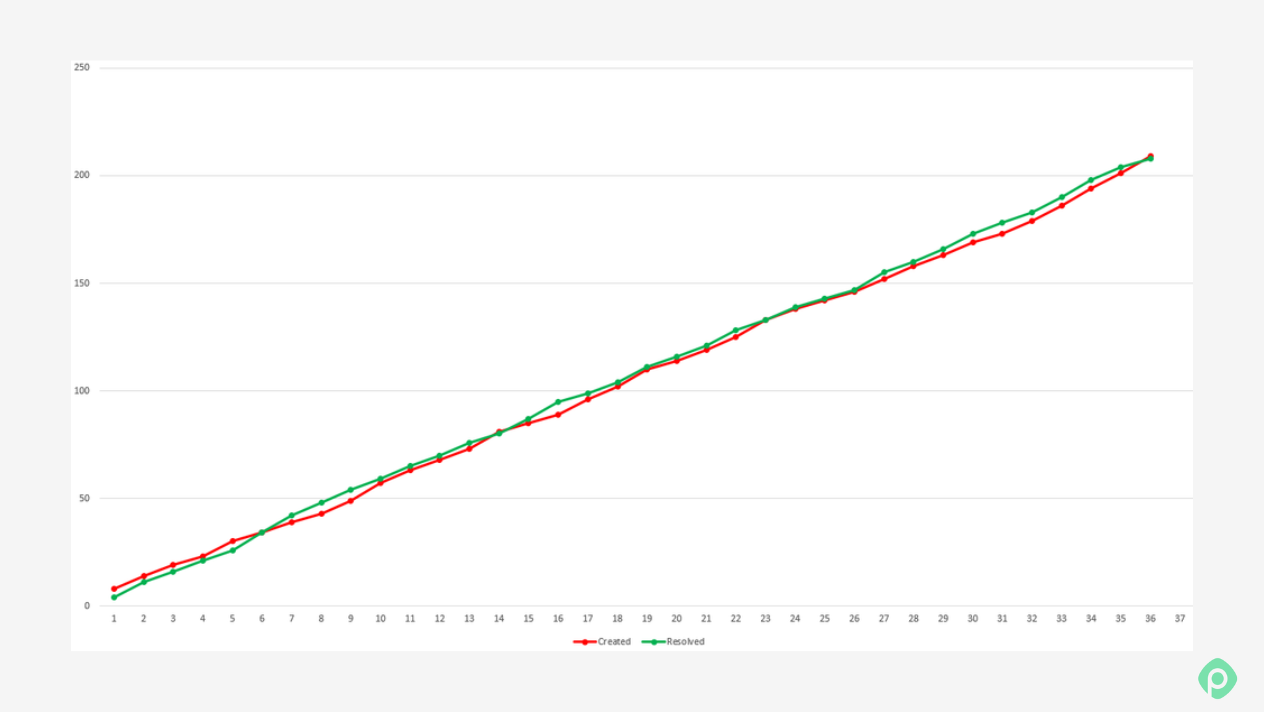
Above, you see the ideal representation of this graph. The team has smooth performance, no major disruptions, and all the “dips” can be explained by staff vacations, for example. It shows the work intake is steady and resolution is keeping pace with it.
Workload distribution vs. capacity
Every team has a member who can do it all, from plugging gaps and writing tests to building super complex features. Naturally, a project manager wants this Swiss Army knife of a developer working on everything, and this can easily happen without anyone noticing.
The problem is that this person becomes a single point of failure disguised as a strength. Their name shows up on more tickets than anyone else's, and they become the one pulled into every "quick fix." On paper, the team looks healthy — velocity's fine, deadlines are being hit — right up until this person takes a week off, or burns out and leaves. By then it's too late to fix with a metric; you're fixing it with a hiring plan.
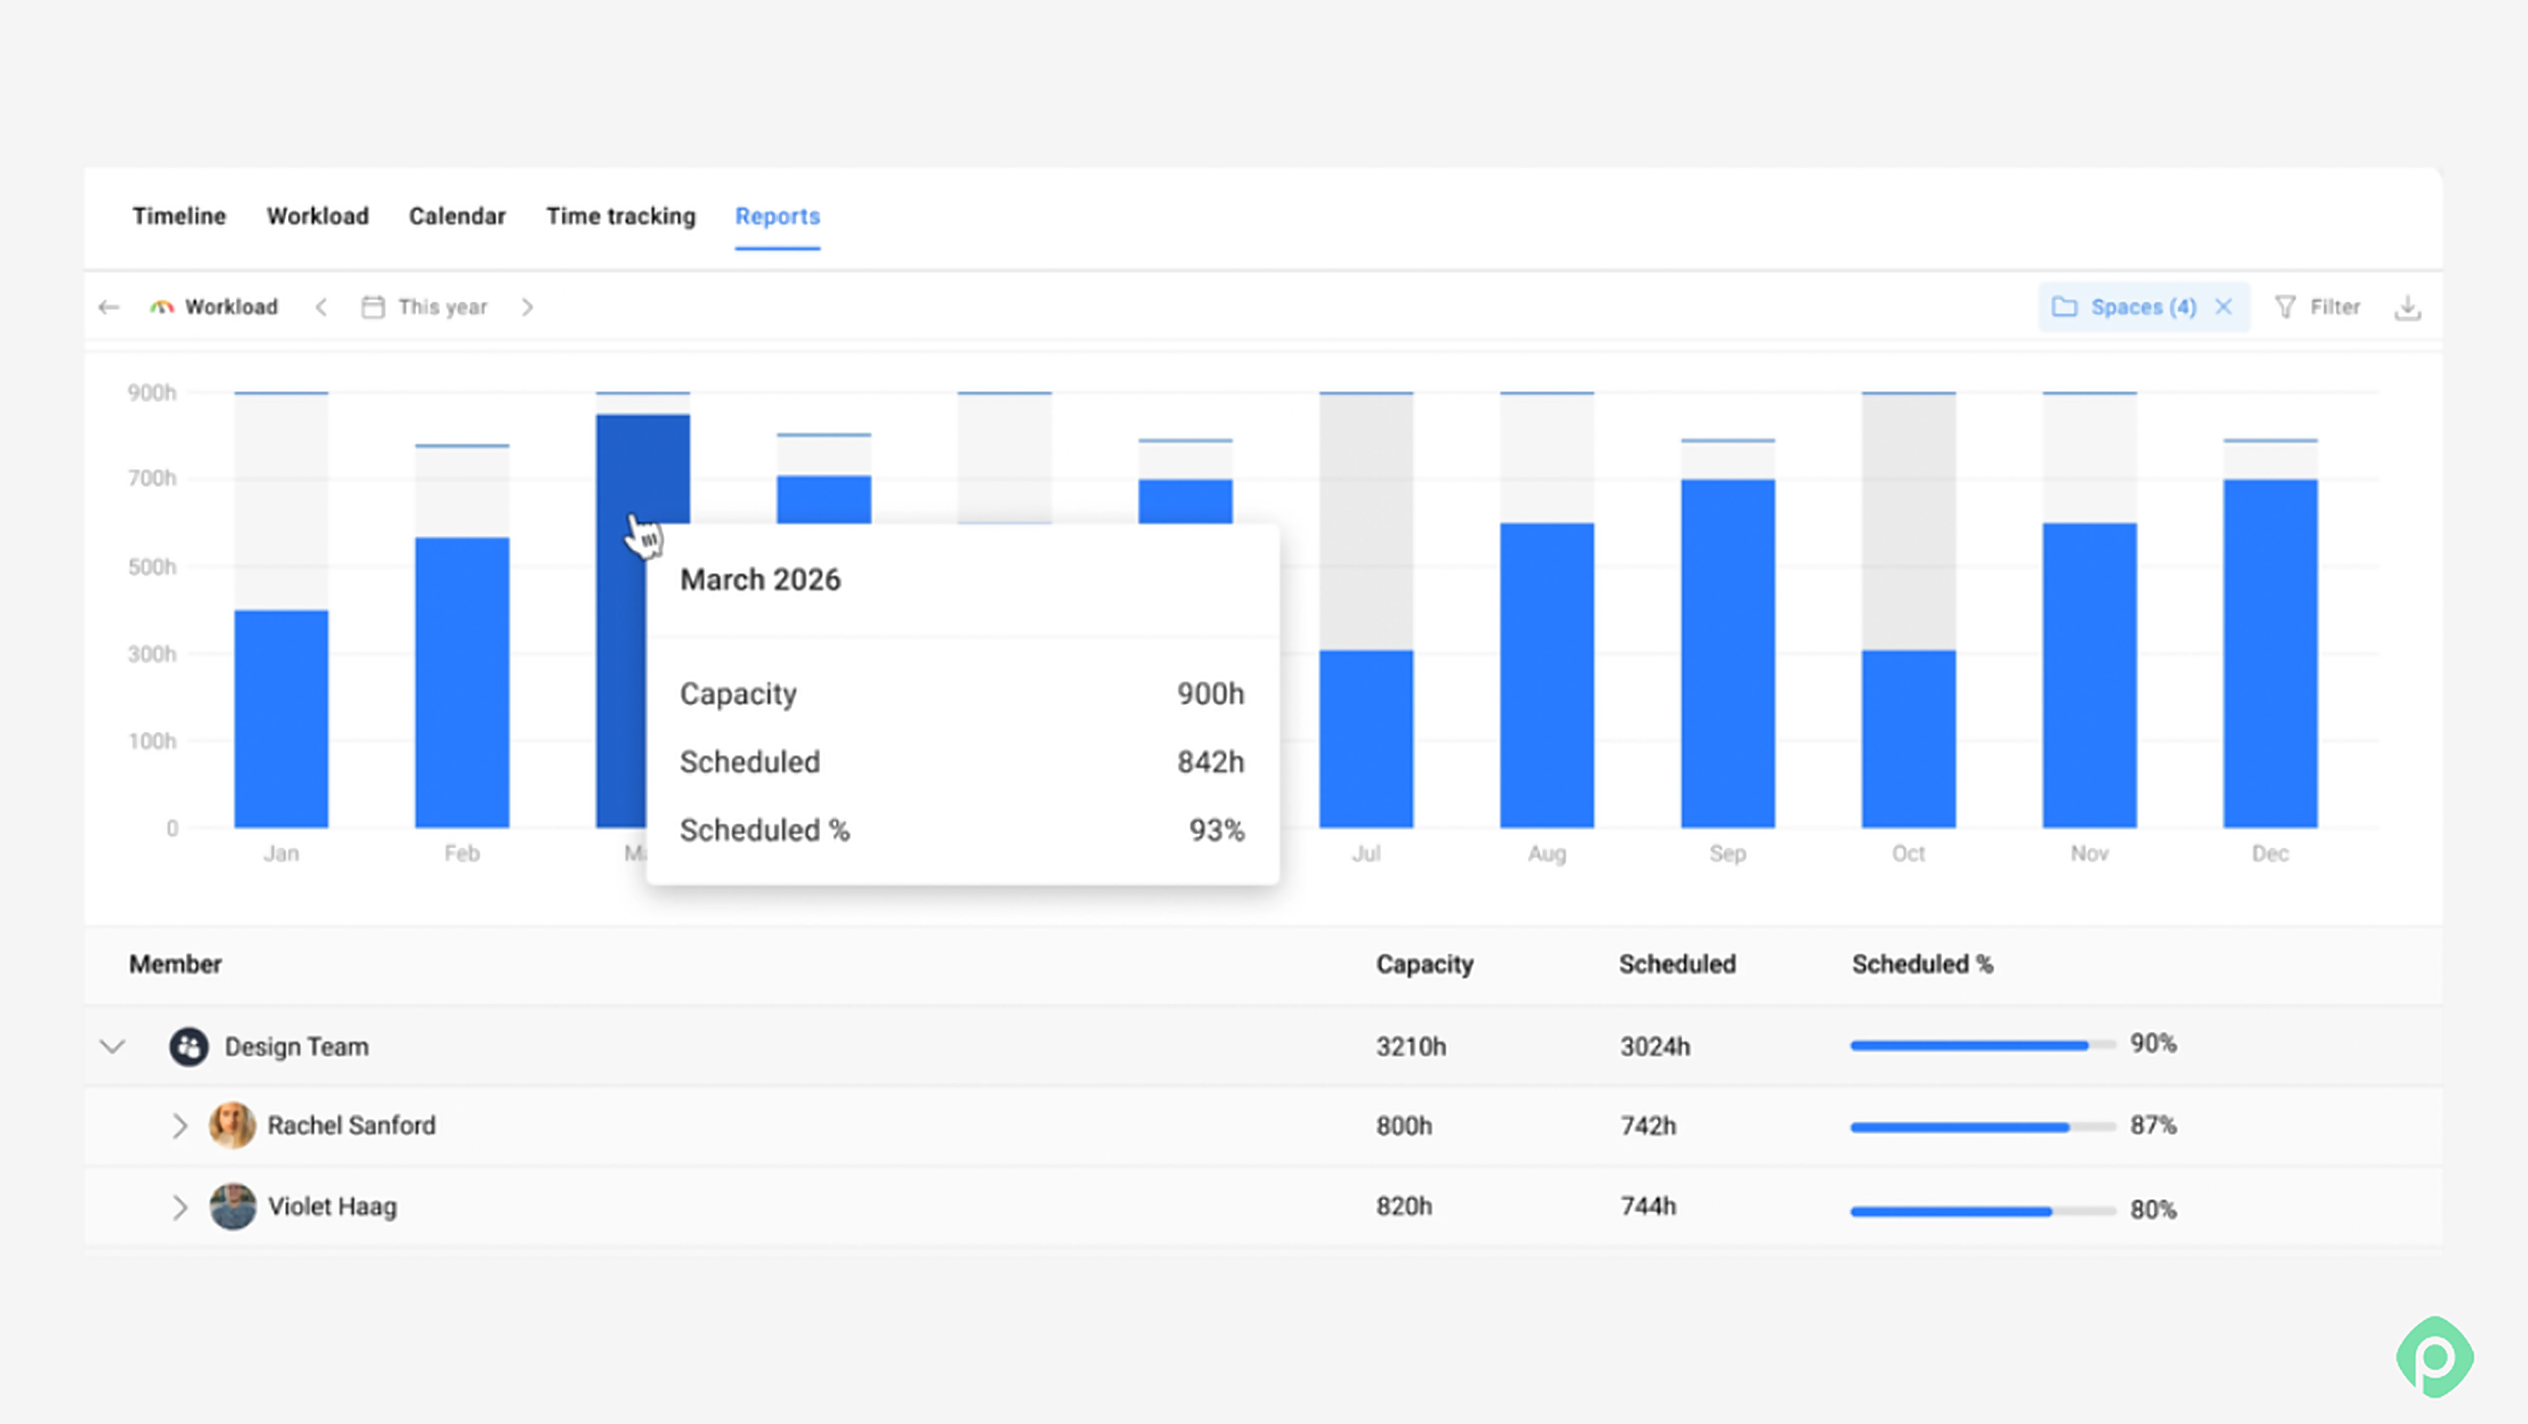
Tracking planned workload against actual allocation, per person, catches this early. Not just "Is the team at capacity?" in aggregate — that number can look perfectly balanced while hiding a massive skew underneath it. You want to see the distribution: who's consistently near or over 100% of their capacity, and who's consistently under. A team's average utilization can sit at a comfortable 80% while one person is at 130% and three others are at 60%.
What is this metric useful for?
Beyond preventing burnout, workload vs. capacity is one of the fastest ways to spot a structural problem in how work is being assigned — often before the person themselves would think to raise it. If the same name keeps absorbing the overflow, that's not a compliment to their skill; it's a gap in how the rest of the team is staffed or trained. Rebalancing early is cheap. Rebalancing after that person is gone is not.
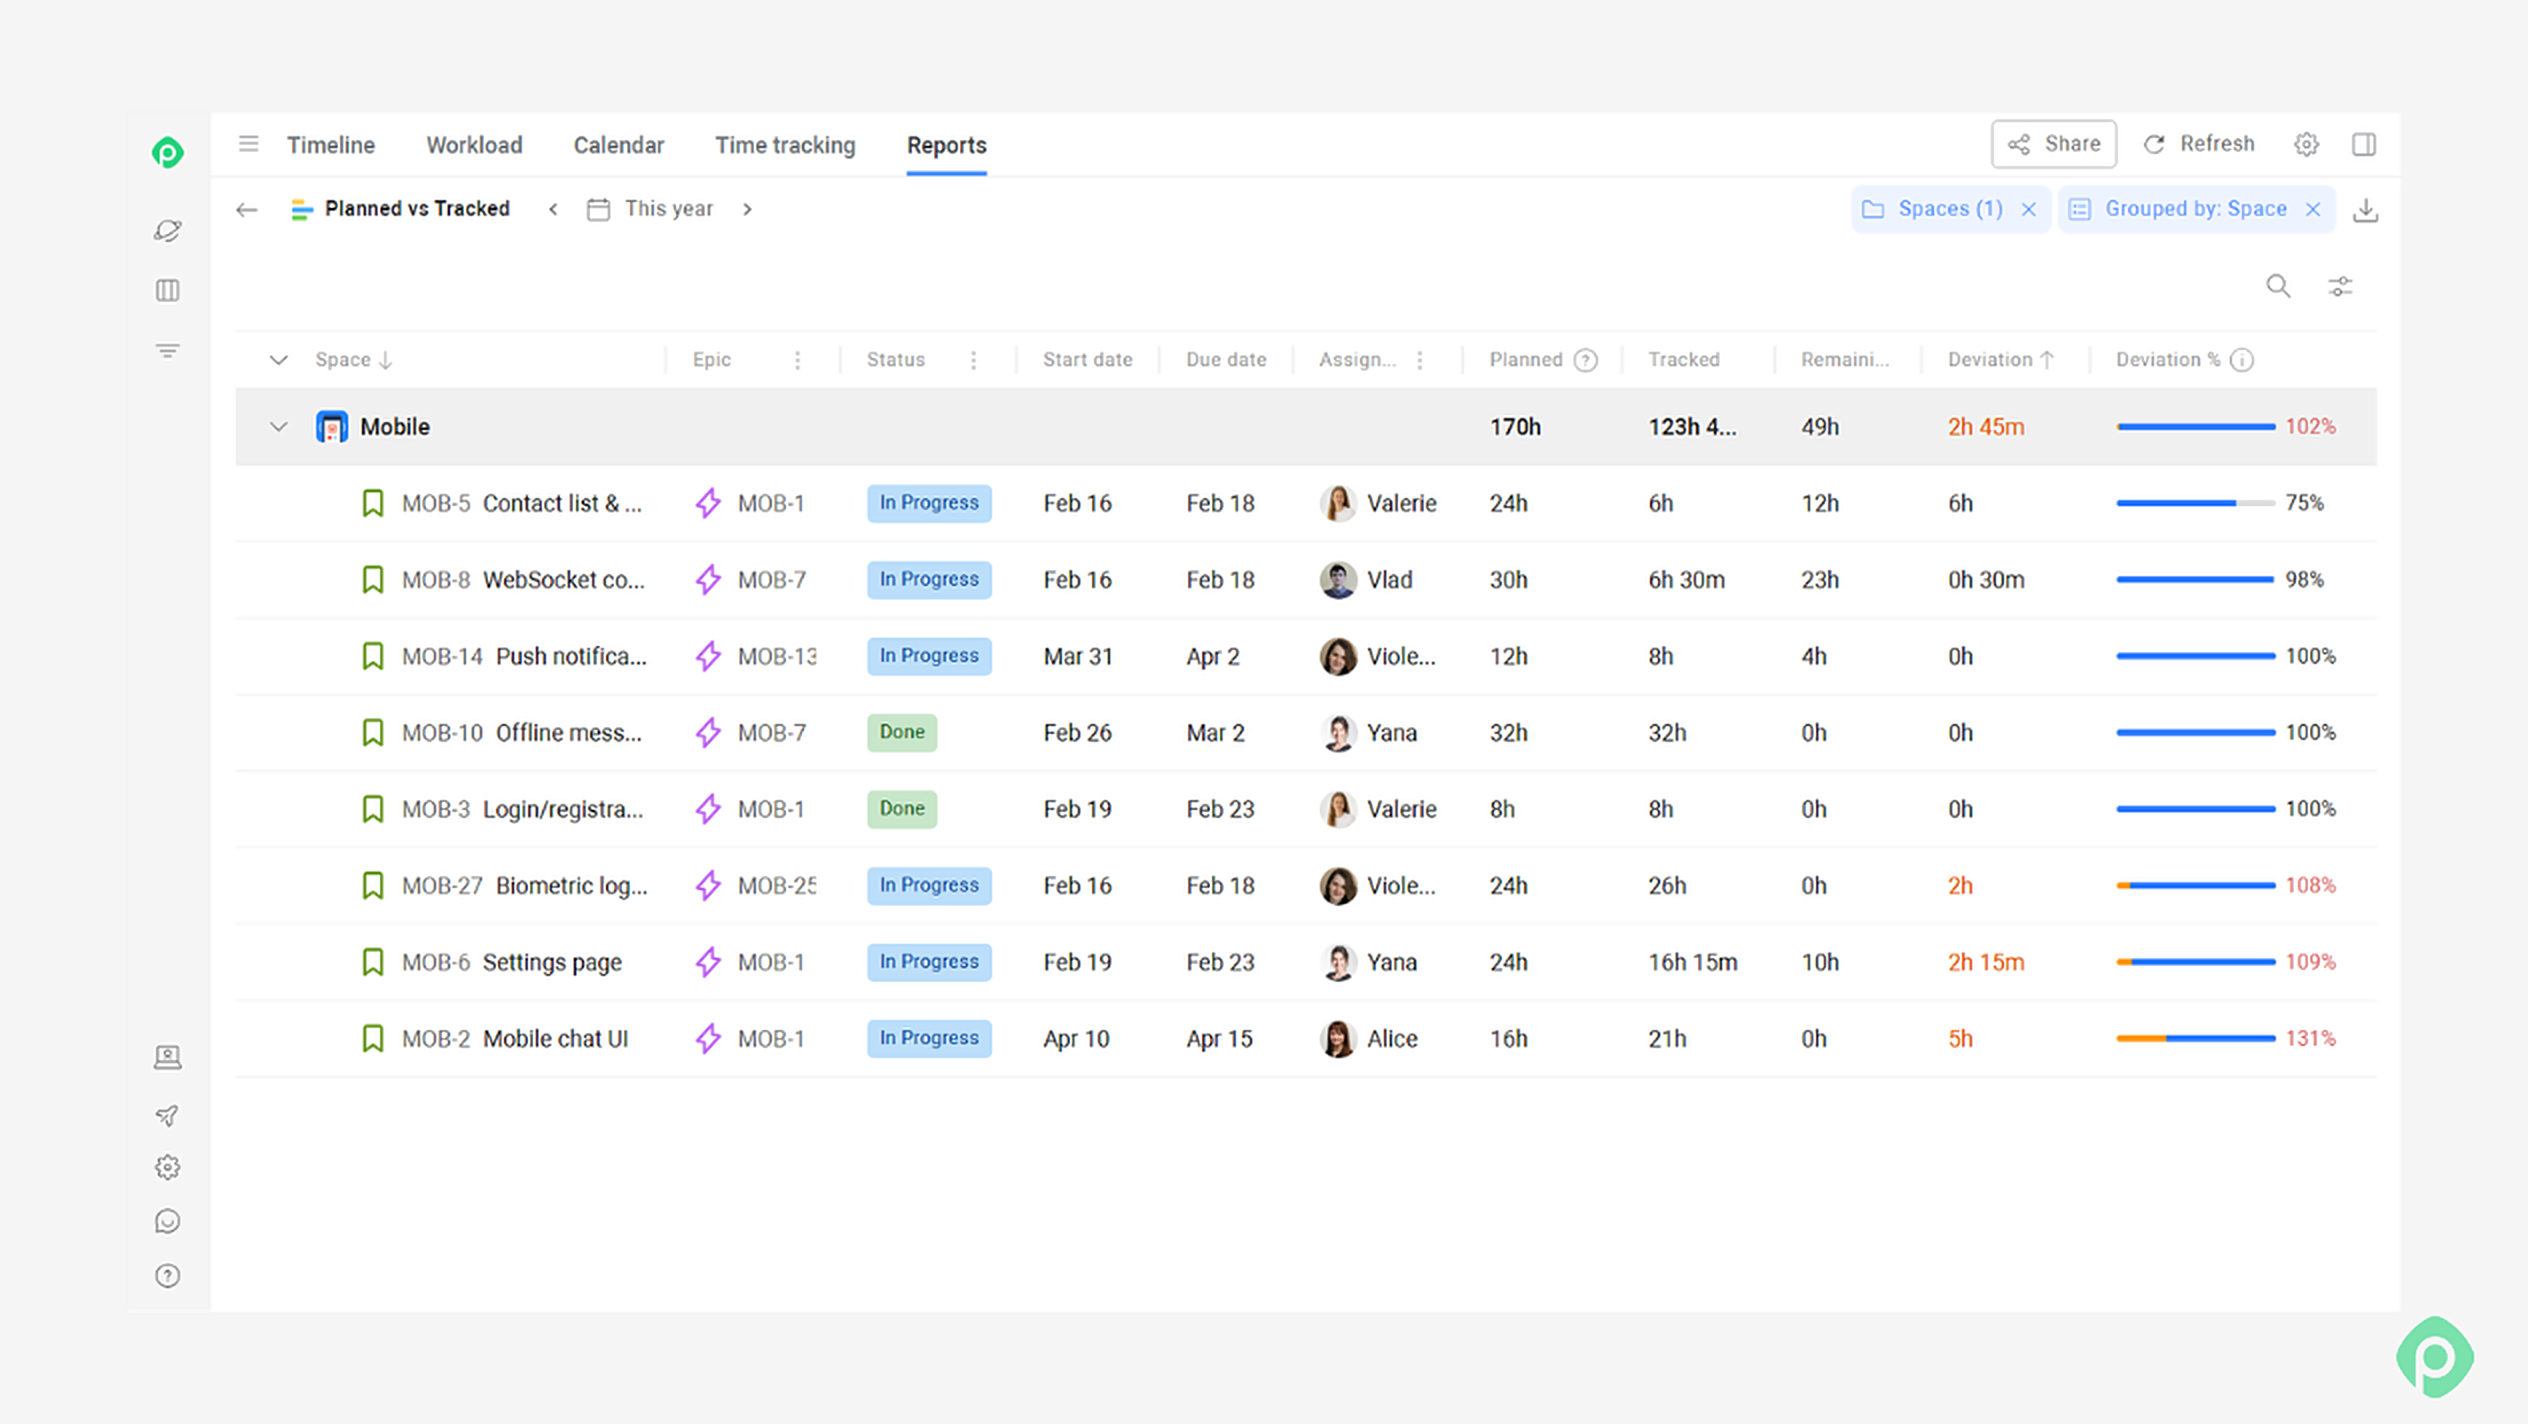
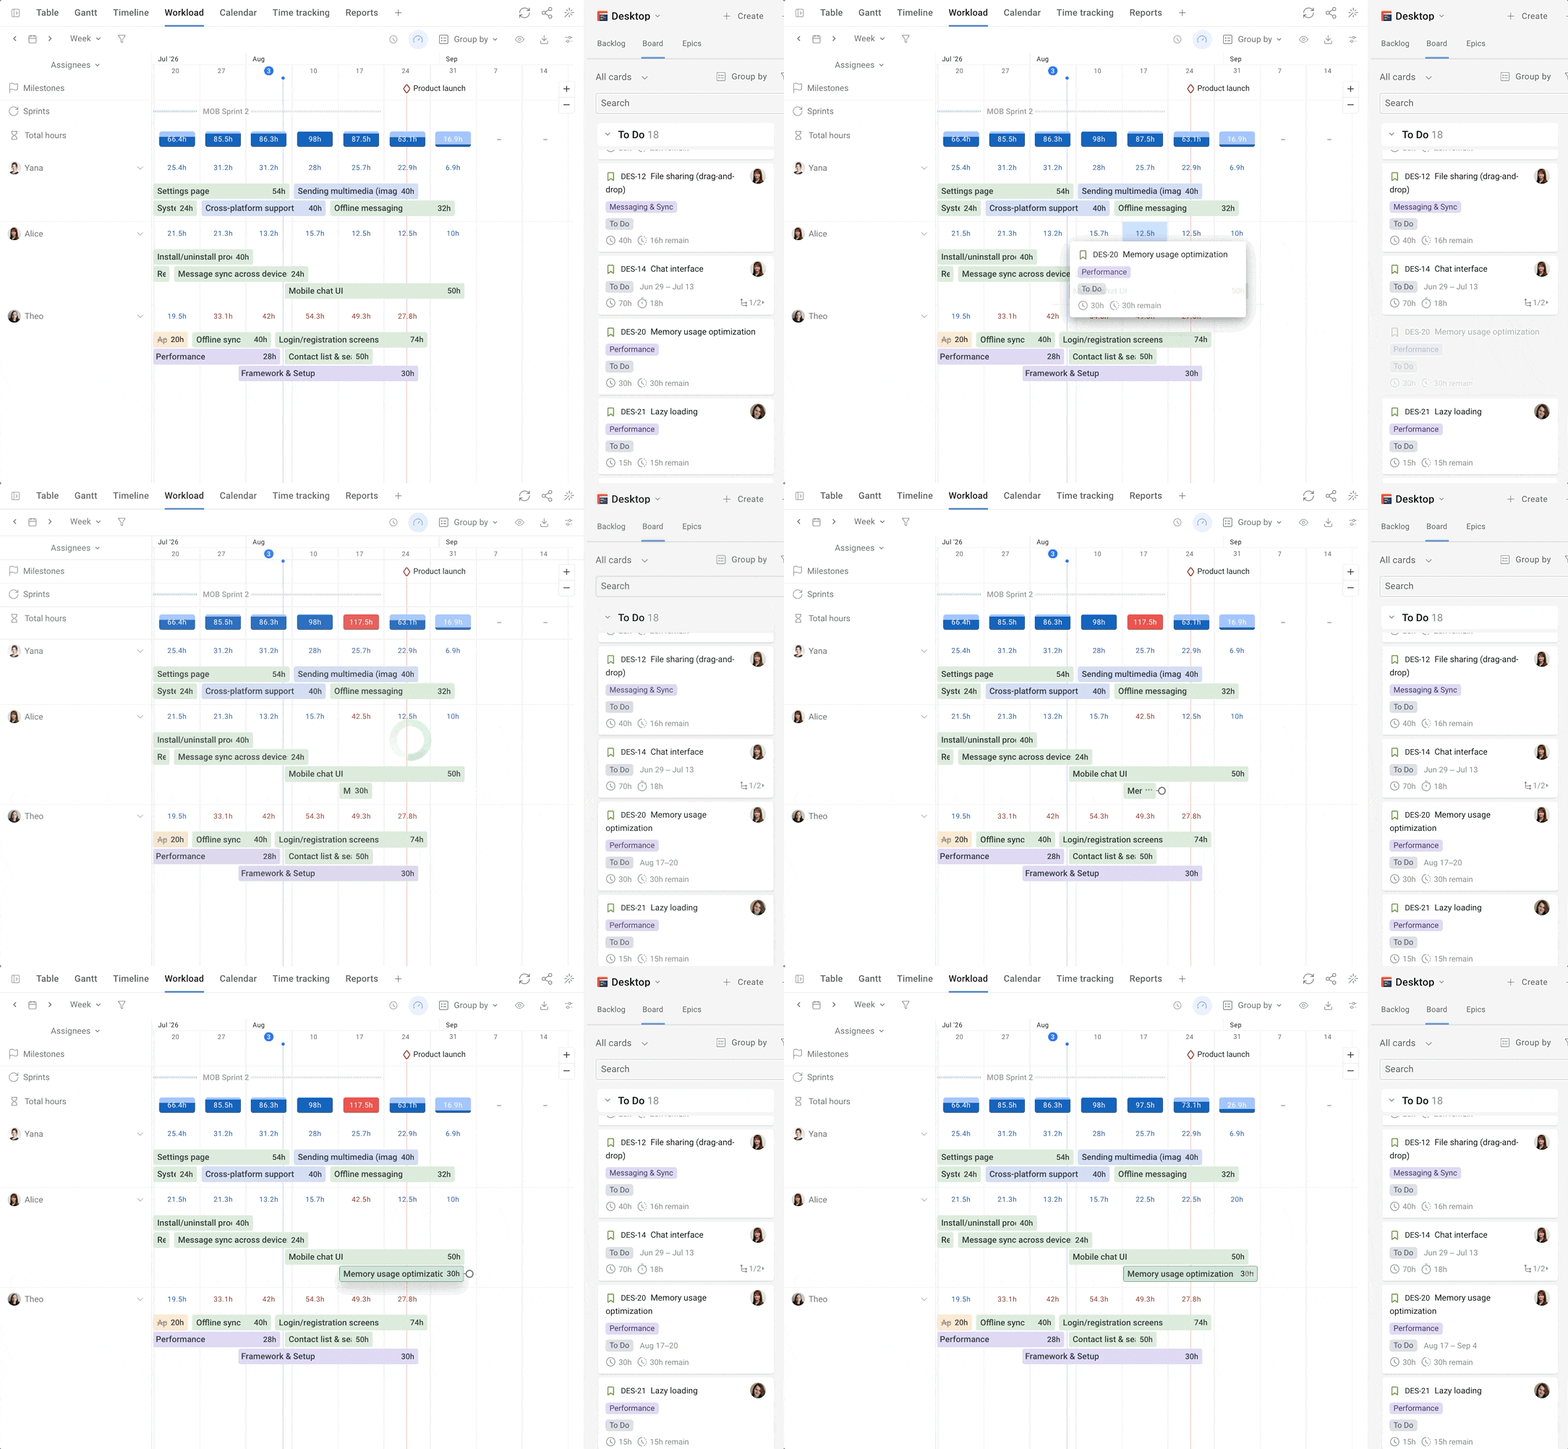
Once you know who's skewed, Planyway's Workload tab is where you fix it (provided you manage capacity in Jira). It's a separate view that shows each person's day-by-day allocation against their capacity right on the timeline, so you can see exactly which days are overloaded and redistribute the work immediately, without digging through Jira issues one by one.
Project task list vs project tracker vs PM software
So once you know what you need to monitor, here's how that maps to which category of tool you actually need. There is a range of tools that may help one to manage complex projects, so unsurprisingly, there can be a great deal of confusion about what to pick for a specific purpose the project manager has in mind. A lot of things really depend on the project scale as well. All of these tools can be loosely broken down into 3 categories.
Task lists
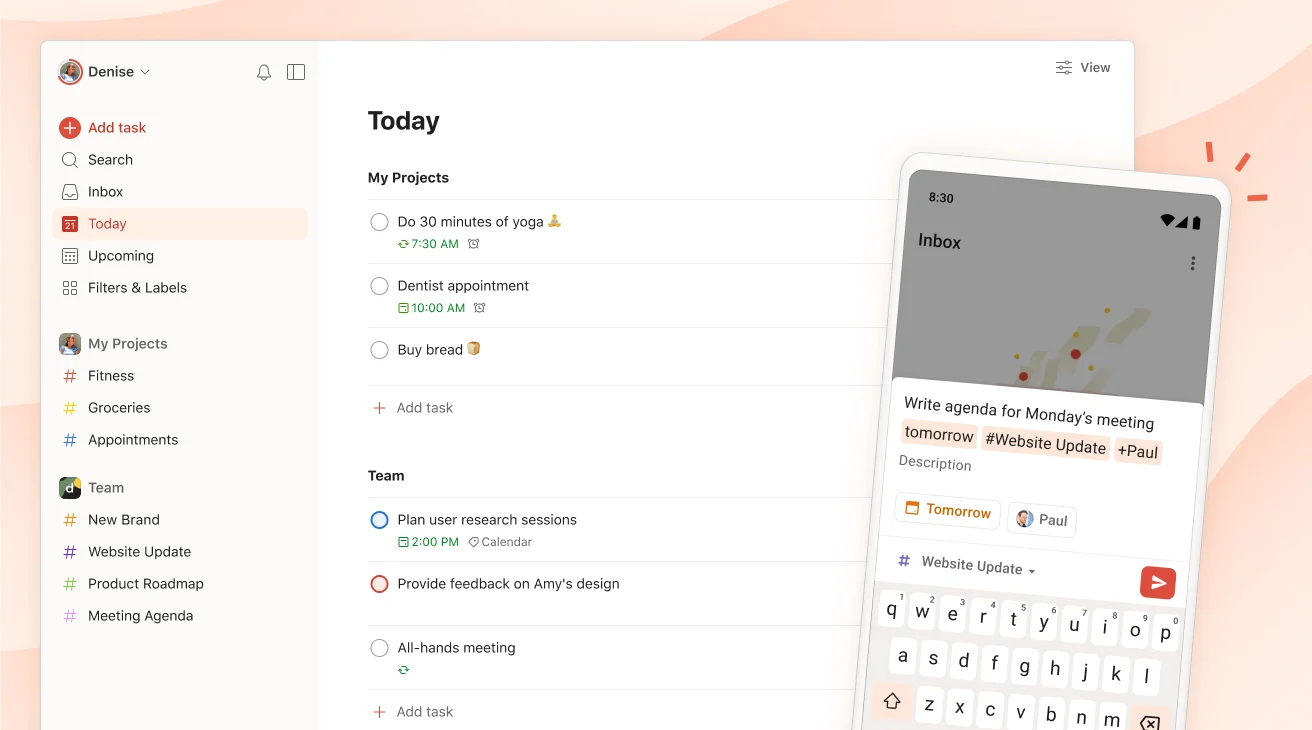
The main goal of a task list is to show you the current status of each task, and not much beyond that. This category often includes task management tools that weren't built for project management but are still used that way, such as notes, lists, Microsoft Excel spreadsheets, and simple boards. A good example is Todoist, where you can create tasks and manage small projects with a small team.
When it's a good fit: a single small project or personal work, where the only question you need answered is "Is it done?" If your team is small and the work is mostly independent tasks, a task list is often all you need.
Signs you've outgrown it: you need to know not just whether tasks are done, but whether you're on track against a deadline; tasks start depending on each other; or you want any of the metrics above (estimation accuracy, created vs. resolved), which a simple list can't produce.
Examples: Todoist, where you can create tasks and manage small projects with a small team, plus plain spreadsheets and notes apps.
Project trackers
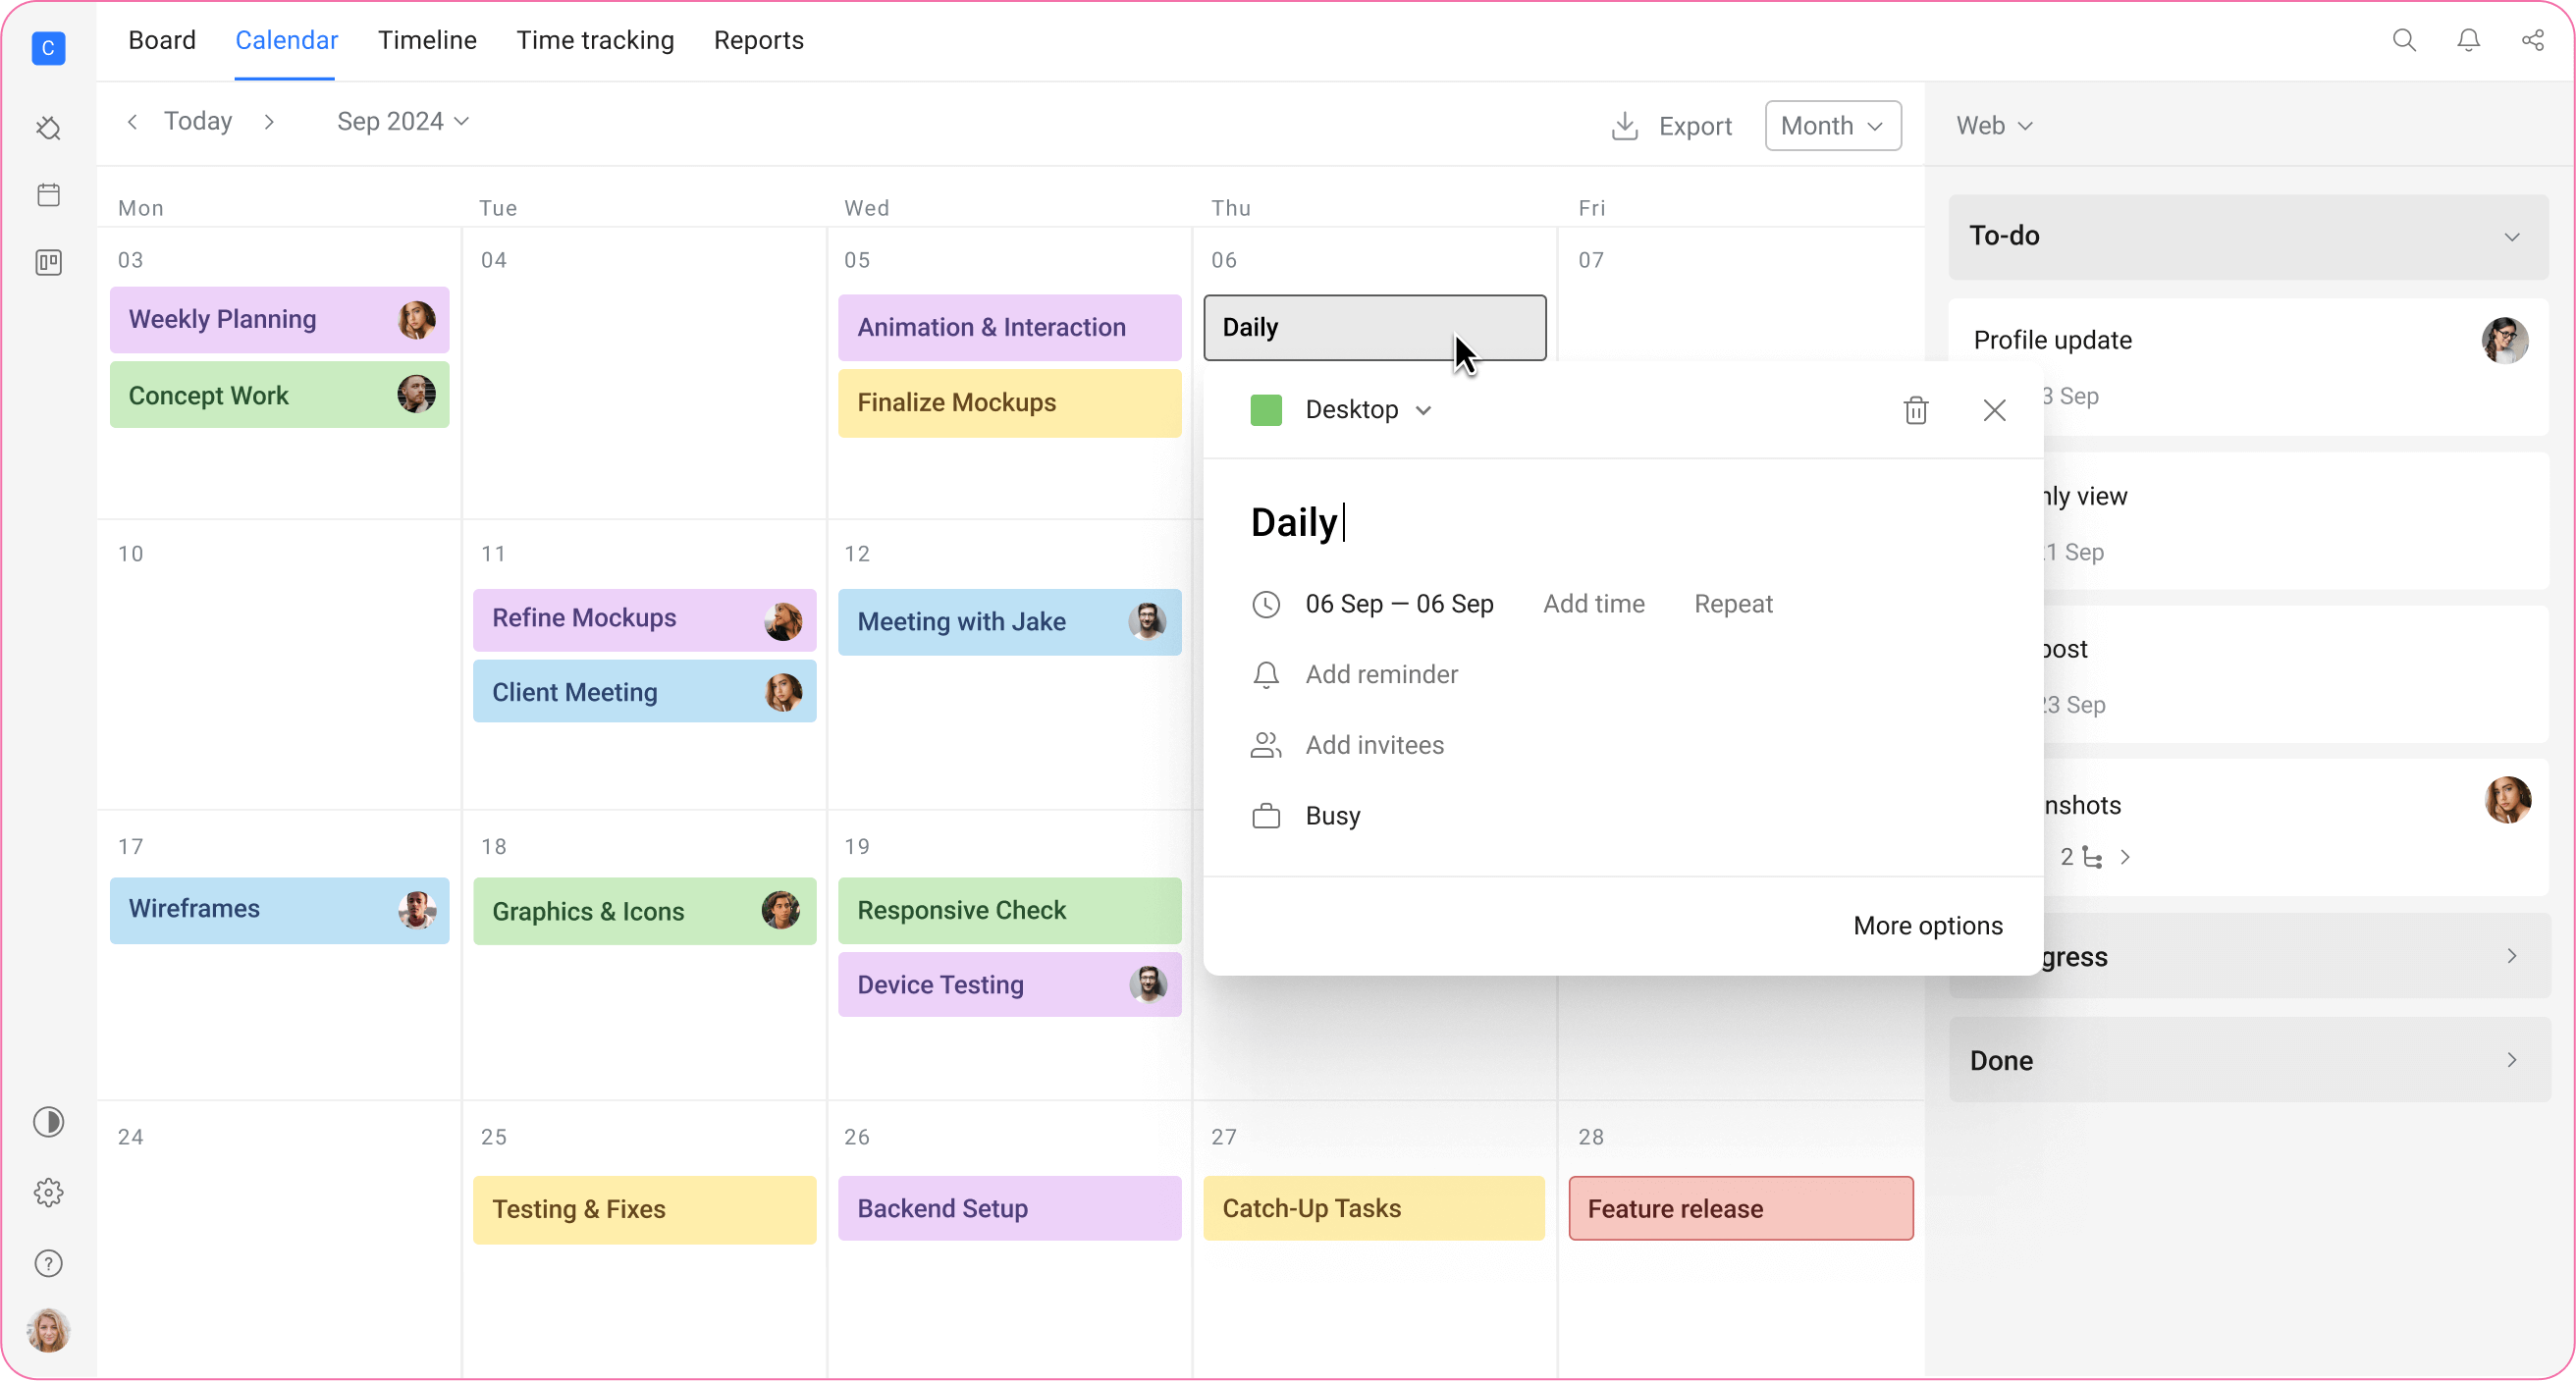
Project trackers are used when a project manager needs to not only know what’s going on and what the status is, but also where things are going. They help to build good structure and visibility and can be either single-project or lightweight multi-project. Such tools already have built-in analytics, and one can inspect the performance of the team, create high-quality reports, and look for trends in the data.
When it fits: a single project or a few lightweight ones, where the key question is "How's it trending against the plan?" This is the level where most of the metrics from this article become available: completion rates, created vs. resolved, cycle time.
Signs you've outgrown it: the same people are split across several projects, and you can't see their total workload; dependencies start crossing team boundaries; or leadership asks for a view across all projects, not just yours. At that point, the problem is no longer tracking a project but coordinating people and resources between projects.
Examples: Trello, Asana, Monday.com, Notion, and Basecamp.
Project management software
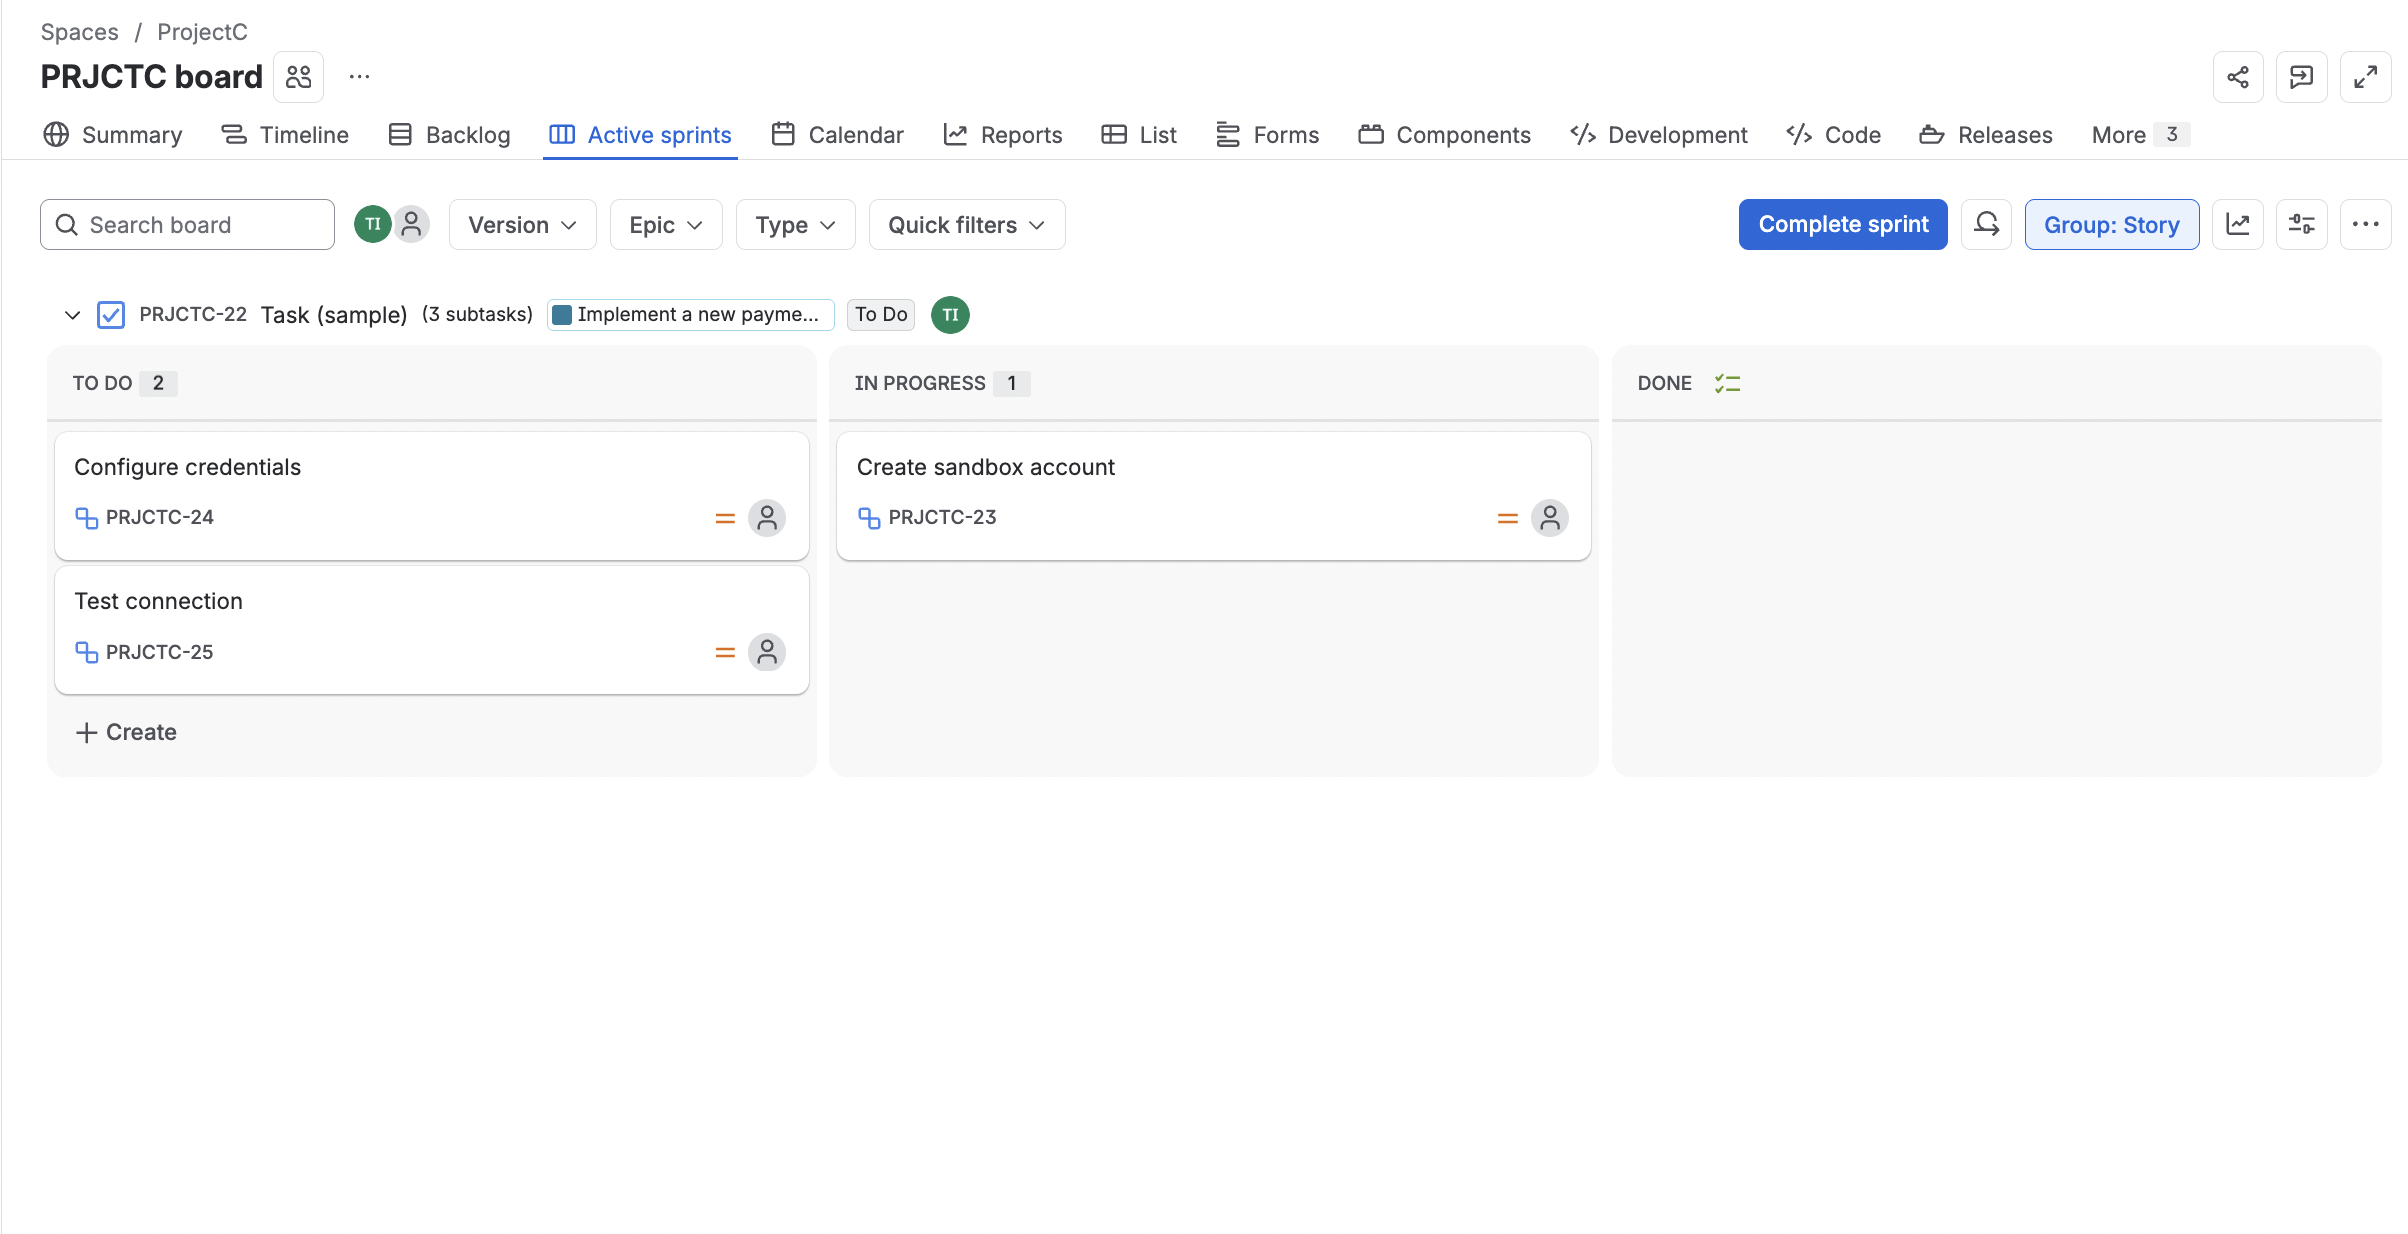
Project management software goes well beyond tracking where the project stands. Beyond reports, dashboards, and extensive data for further analysis, it lets you plan work on project timelines and Gantt charts, map dependencies between tasks and teams, manage resources and cross-team collaboration, and scale up to portfolio-level work.
When it fits: managing multiple projects that share people and resources, where the question is "How does this fit with everything else the team or org is doing?" This is where metrics like workload distribution vs. capacity really pay off: you can only spot an overloaded team member if you see their work across all projects at once.
When it's overkill: a small team working on a single project with few dependencies. Setting up and maintaining a full PM system takes time, and if nobody acts on the extra data, it's just more noise to review.
Examples: Jira (especially with add-ons like Planyway for scheduling and workload), Microsoft Project, Wrike, and Planview.
We've summed up the main differences between the types of project tracking tools below:
| Task Lists | Trackers | Project management software | |
| Question it answers | Is it done? | How's it trending against plan? | How does this fit across everything else the team/org is doing? |
| General purpose | Capture and check off individual tasks | Monitor progress, status, and simple team performance over time | Coordinate people, resources, and multiple projects at once |
| Project scale | Single, small project or personal use | Single project or a few lightweight ones | Multiple projects up to portfolio level |
| Analytics & reporting | None to minimal | Built-in trend/performance reports (burndown, completion rate, etc.) | Extensive dashboards, cross-project and resource-level reporting |
| Common feature range | Task lists, due dates, basic checklists | Boards/backlogs, status tracking, basic time/workload views, simple automations | Workload & capacity planning, dependencies, scheduling, portfolio views, integrations |
It should be mentioned, however, that some of these tools can be dual-purpose, depending on setup. For example, Asana and Monday.com can grow from simple trackers into near-PM-software territory, depending on how much structure a team builds into them. Jira, in turn, can run as a bare task tracker or a full PM system, depending on its plugins and configuration. This reinforces the point: the category matters less than the job you need the tool to do.
Project tracking template (but there's a catch)
Search for "project tracking template," and you'll find roughly the same thing everywhere: a spreadsheet with projects, tasks, owners, dates, and statuses, plus a Gantt view and maybe a workload tab. We've put together our own version, and you can download it here:
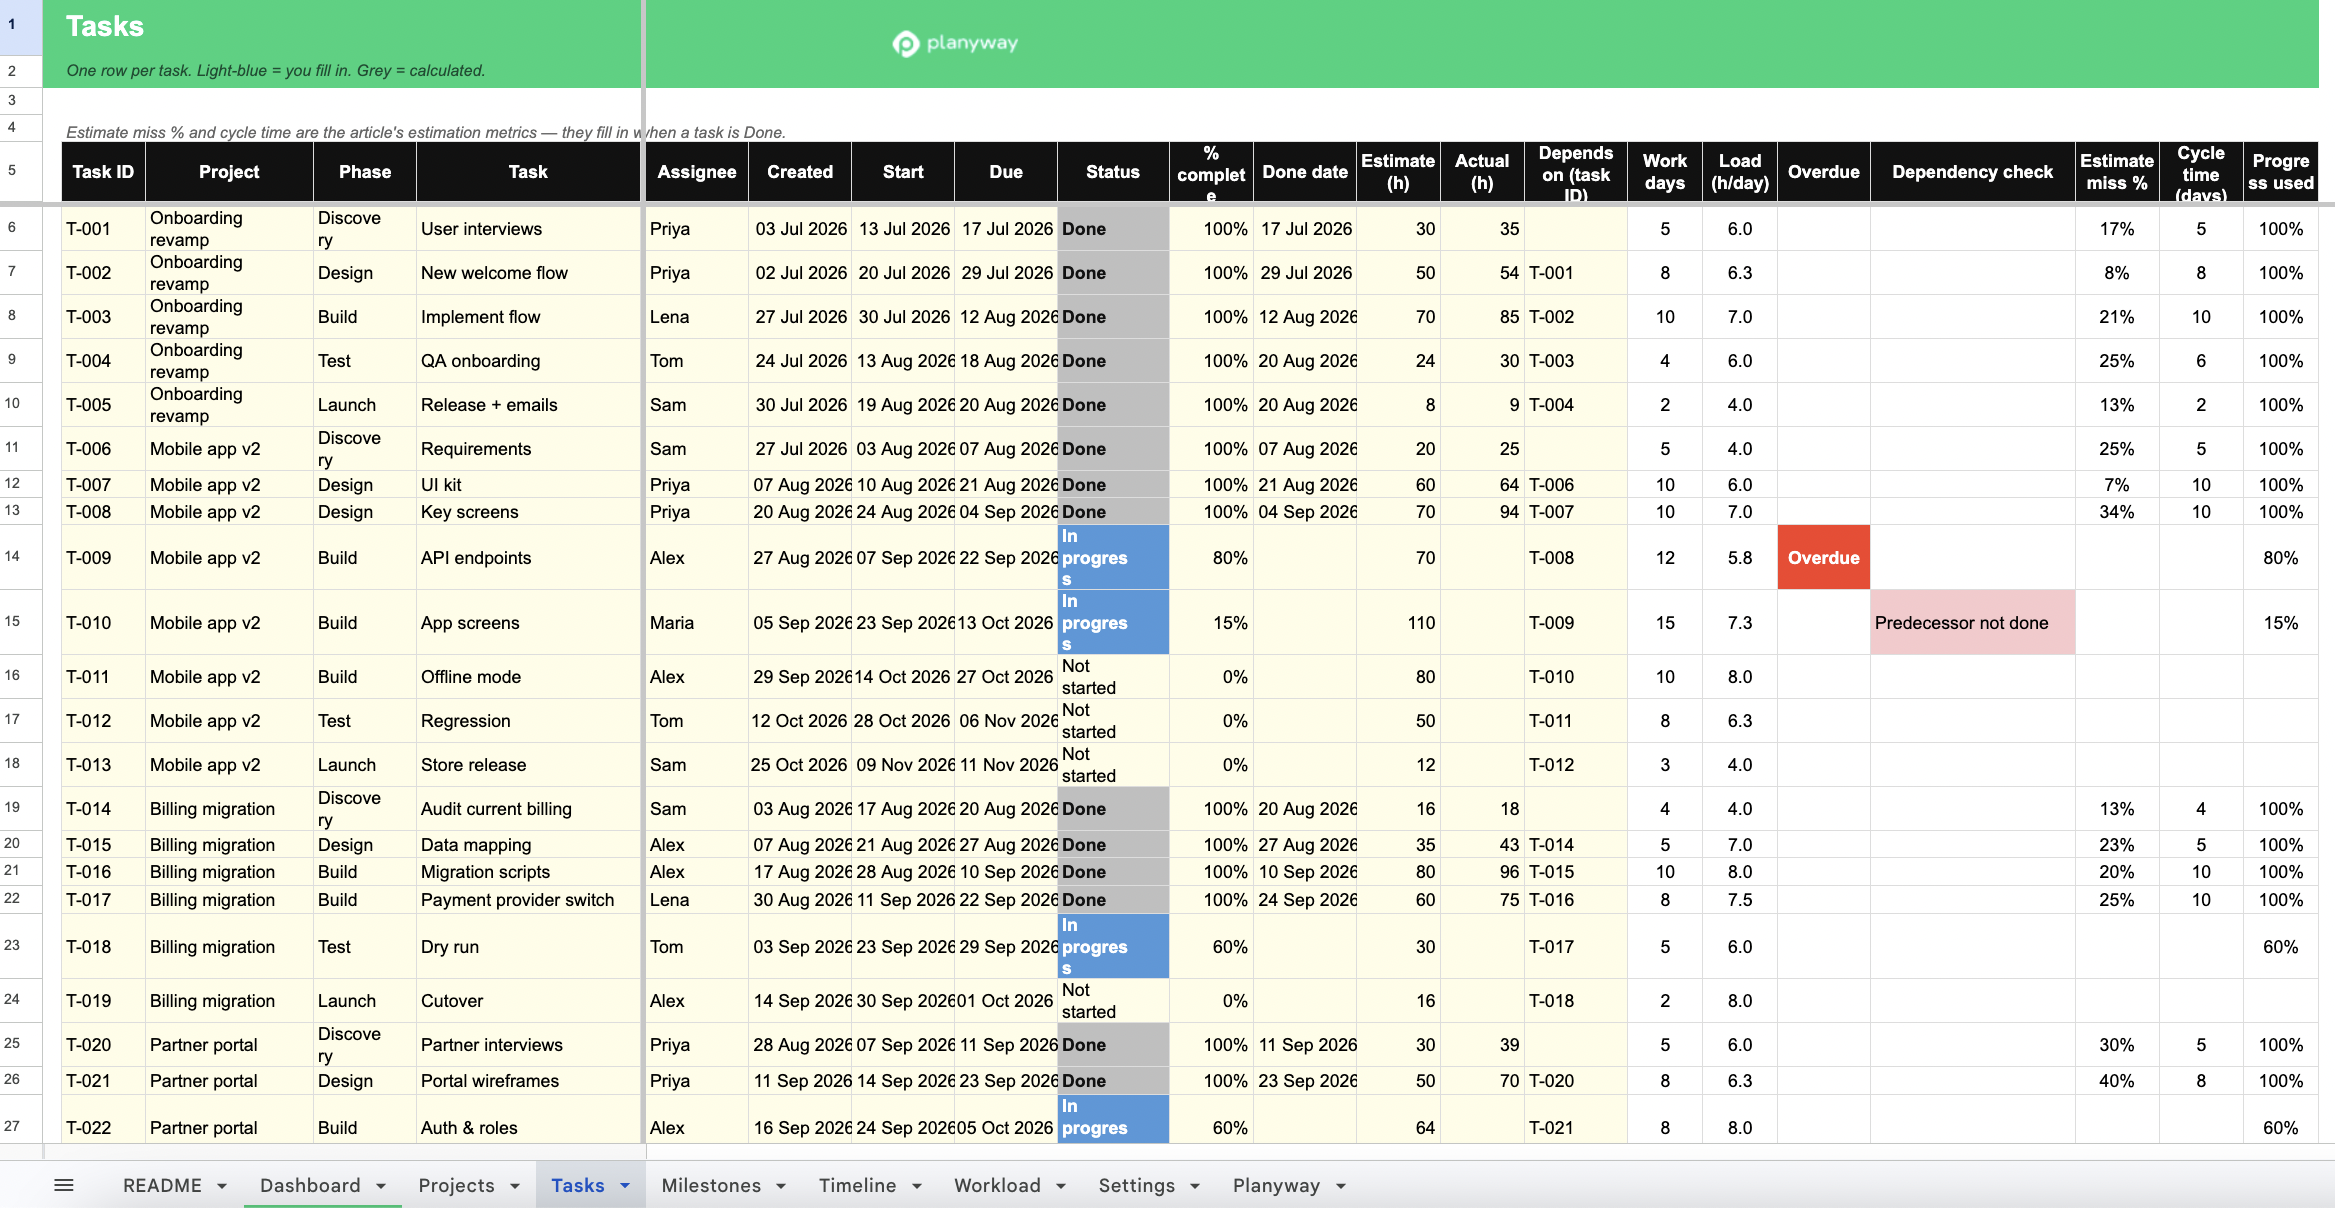
This project tracking template covers the basics well, including task management, a weekly timeline, workload, and more. It even calculates a few of the metrics from this article, such as estimate accuracy, cycle time, and created vs. resolved.
But it's still a generic template.
Its columns were chosen to fit everyone, which means they weren't chosen for your project. If you want to do it properly, the template should come out of your goals, not the other way around.
That's the key takeaway from everything above: there's no universal tracking template. The right one depends on what you need to know about your project.
Instead, when you think about what to track and how, first, we suggest adopting the following simple table as a framework for determining the right metrics for your project.
| Goal | Question | Metric | Current | Trend | Action |
| Deliver on time | Are we still on track? | Schedule variance | +5 days | ↗ | Re-plan |
| Improve predictability | Are our estimates becoming more accurate? | Estimation variance | +18% | ↘ | Review estimation process |
| Keep flow predictable | Do larger tasks actually take longer? | Cycle time by estimation group | 1–8 SP: stable; 13–21 SP: highly variable | ↗ | Review task breakdown |
| Keep work intake manageable | Are we resolving work as fast as it arrives? | Created vs. Resolved | 42 / 35 | ↗ | Investigate growing backlog |
| Keep workload sustainable | Is work distributed evenly? | Workload vs. capacity | 1 person >120% | ↗ | Rebalance work |
Depending on your needs, you could also add columns such as Data Source, Reason for tracking, Owner, or Review frequency. But even in this case, it's just a starting point that you would have to adapt to the needs of your project, especially as the project moves through different stages.
These questions help you adjust and nail down the data to track progress of your project specifically:
At the start
- What should the end result look like for each aspect of the project?
- What are we trying to achieve?
- What could derail us?
- What signals would warn us early?
- What data do we need to collect and why?
In the middle
- Are those signals actually telling us something?
- Are estimates becoming more accurate?
- Is work flowing consistently?
- Do we have any bottlenecks?
- Is workload becoming concentrated?
- Are we still tracking something just because we started tracking it?
Towards the end
- Which metrics actually predicted problems?
- Which were just noise?
- What baseline did we establish for the next project?
- What would we track differently next time?
The final word
The core idea running through this article is simple, even if it goes against how most teams approach tracking: the process comes first, the tool comes second. Metrics derived from a specific question (via GQM) will always beat metrics copied from someone else's list, because they're tied to something you actually need to know.
Some of the most valuable signals — estimation accuracy, cycle time by task size, workload distribution — are also the ones most teams skip, precisely because they take a bit more effort to set up than a status column. And the "best" tool was never really about task lists vs. trackers vs. PM software as categories; it's about which of those jobs your project actually needs done.


FAQ
There isn't one — the right project tracking software depends on what you're actually trying to monitor. A task list is enough if you just need to know what's done. A tracker adds visibility into trends, team performance, and overall progress. Full PM software is for coordinating resource allocation and schedules across multiple projects or an entire portfolio. Pick based on the question you need answered, not brand recognition — that's what helps you manage projects effectively.
Yes, for small projects or a single team — it's essentially a manual task list, and plenty of teams track a simple project plan or project budget this way, often starting from a free project timeline template. The limits show up as the project grows: no automation, no live updates, no easy way to visualize progress, and building trend charts (like the ones covered above) means manually rebuilding them every time your data changes.
To monitor progress effectively, don't measure it with one generic number. Define your goal, ask what would actually tell you if you're on or off track (for example, comparing actual progress against the next project milestone), and pick metrics that answer those specific questions (the Goal-Question-Metric approach). It's more effective than tracking a standard list of metrics that may not reflect what actually drives successful project outcomes.
Start from a concrete goal, turn it into the questions you need answered, and keep only the metrics someone will act on. Then choose a tool that matches the job, whether that's a task list, a tracker, or full PM software. Where possible, connect it to your real work data (for example, Jira with Planyway) so the tracker updates itself.
Construction projects lean more heavily on schedule, cost, and project scope control than software development projects do. Critical path method (CPM) status, schedule/cost variance, and earned value metrics (SPI, CPI) tend to matter more here, since delays and cost overruns compound quickly across project phases and are harder to reverse. Resource allocation, including equipment, also plays a bigger role than in most software contexts. The core principle from this article still applies: identify what could actually derail the project and track that specifically. That's what drives successful delivery, not a generic template.