Jira Story Points: a complete guide to effortless estimation

If you manage Jira projects, you've probably run into story points already — the numbers teams argue over in almost every sprint planning session. They represent relative effort: how big, complex, risky, or uncertain a piece of work is compared to everything else in the backlog.
That's also where things get messy in practice. The same user story can land as a 3 for a senior engineer and an 8 for someone newer — and both are kind of right, which is exactly the problem. This guide explains how Jira story points work and how teams can turn their estimates into valuable insights that resonate beyond the team.
TL;DR
- In Jira, story points are the team's shared estimate of how much relative effort the entire team expects an issue to take. They are not about hours logged by any one person. The team arrives at them by comparing multiple stories against each other, which works best as team collaboration rather than one person guessing alone.
- Many teams use the Fibonacci‑like sequence (1, 2, 3, 5, 8, 13) because people are much better at saying “this is about twice as hard” than “this is exactly three hours harder.”
- An estimate that only has meaning because the team agreed on it loses that meaning outside that team. In dashboards, client SLAs, or shared Jira instances, those numbers tend to become something people manage rather than genuinely estimate. Translating to hours or dollars for outsiders is sometimes necessary, though that external figure should not feed back into Jira and alter the original estimate — the two numbers serve different purposes.
What are Jira Story Points, really?
Jira Story Points are a relative measure of the effort needed to complete a piece of work. Instead of estimating work in hours or days, Agile teams assign a point value to an issue based on how large, complex, and uncertain it is compared with other work in the backlog.
Here’s another important consideration: Jira doesn't prescribe how your team should estimate Story Points. It provides the estimation field and uses those estimates across the backlog, sprint planning, and reports. The actual number comes from the team's estimation process.
What do Story Points measure?
A story point value isn't a stand-in for hours — it's a way of expressing the effort required to get something done, relative to everything else sitting in the backlog. Pose the same question to five teammates, and you'll likely hear five different numbers. That's not a flaw — it's exactly the discussion the process is designed to trigger.
For example, if a team considers a small, straightforward change worth one story point, a feature with more moving parts and unknowns might be a 5. The exact numbers aren't important on their own. What matters is that the whole team uses the same scale consistently.
Three things typically drive the point value:
- Effort — how much work is actually involved
- Complexity — how technically challenging it is
- Uncertainty — how much is still unknown
Setting up Story Points in Jira: team-managed vs. company-managed
Before a single ticket gets a number, we need to make sure story points in Jira work the way we expect. Jira runs two different project types: Team-managed and Company-managed. They handle estimation through two different fields, not one.
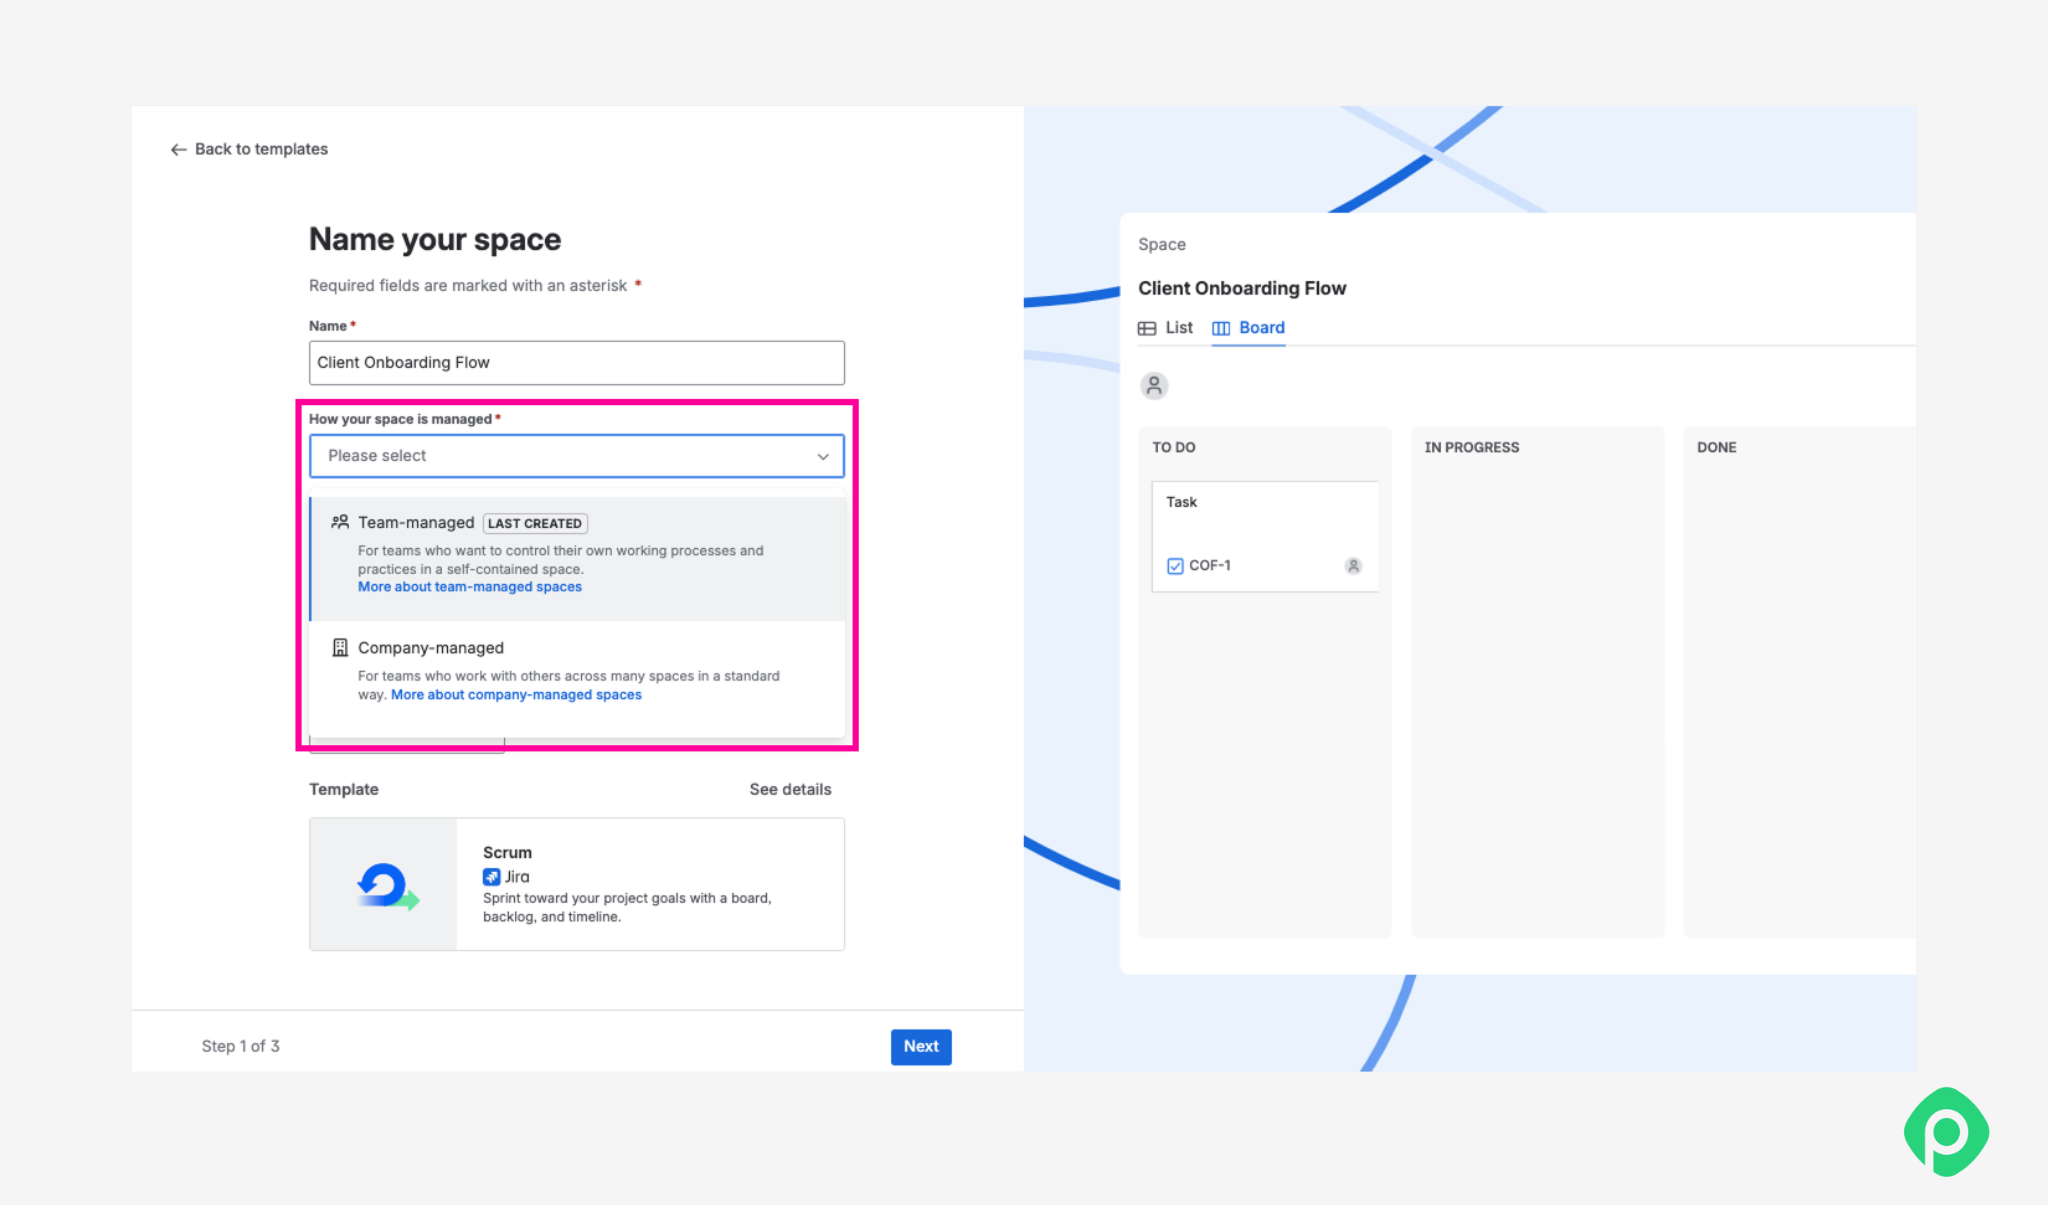
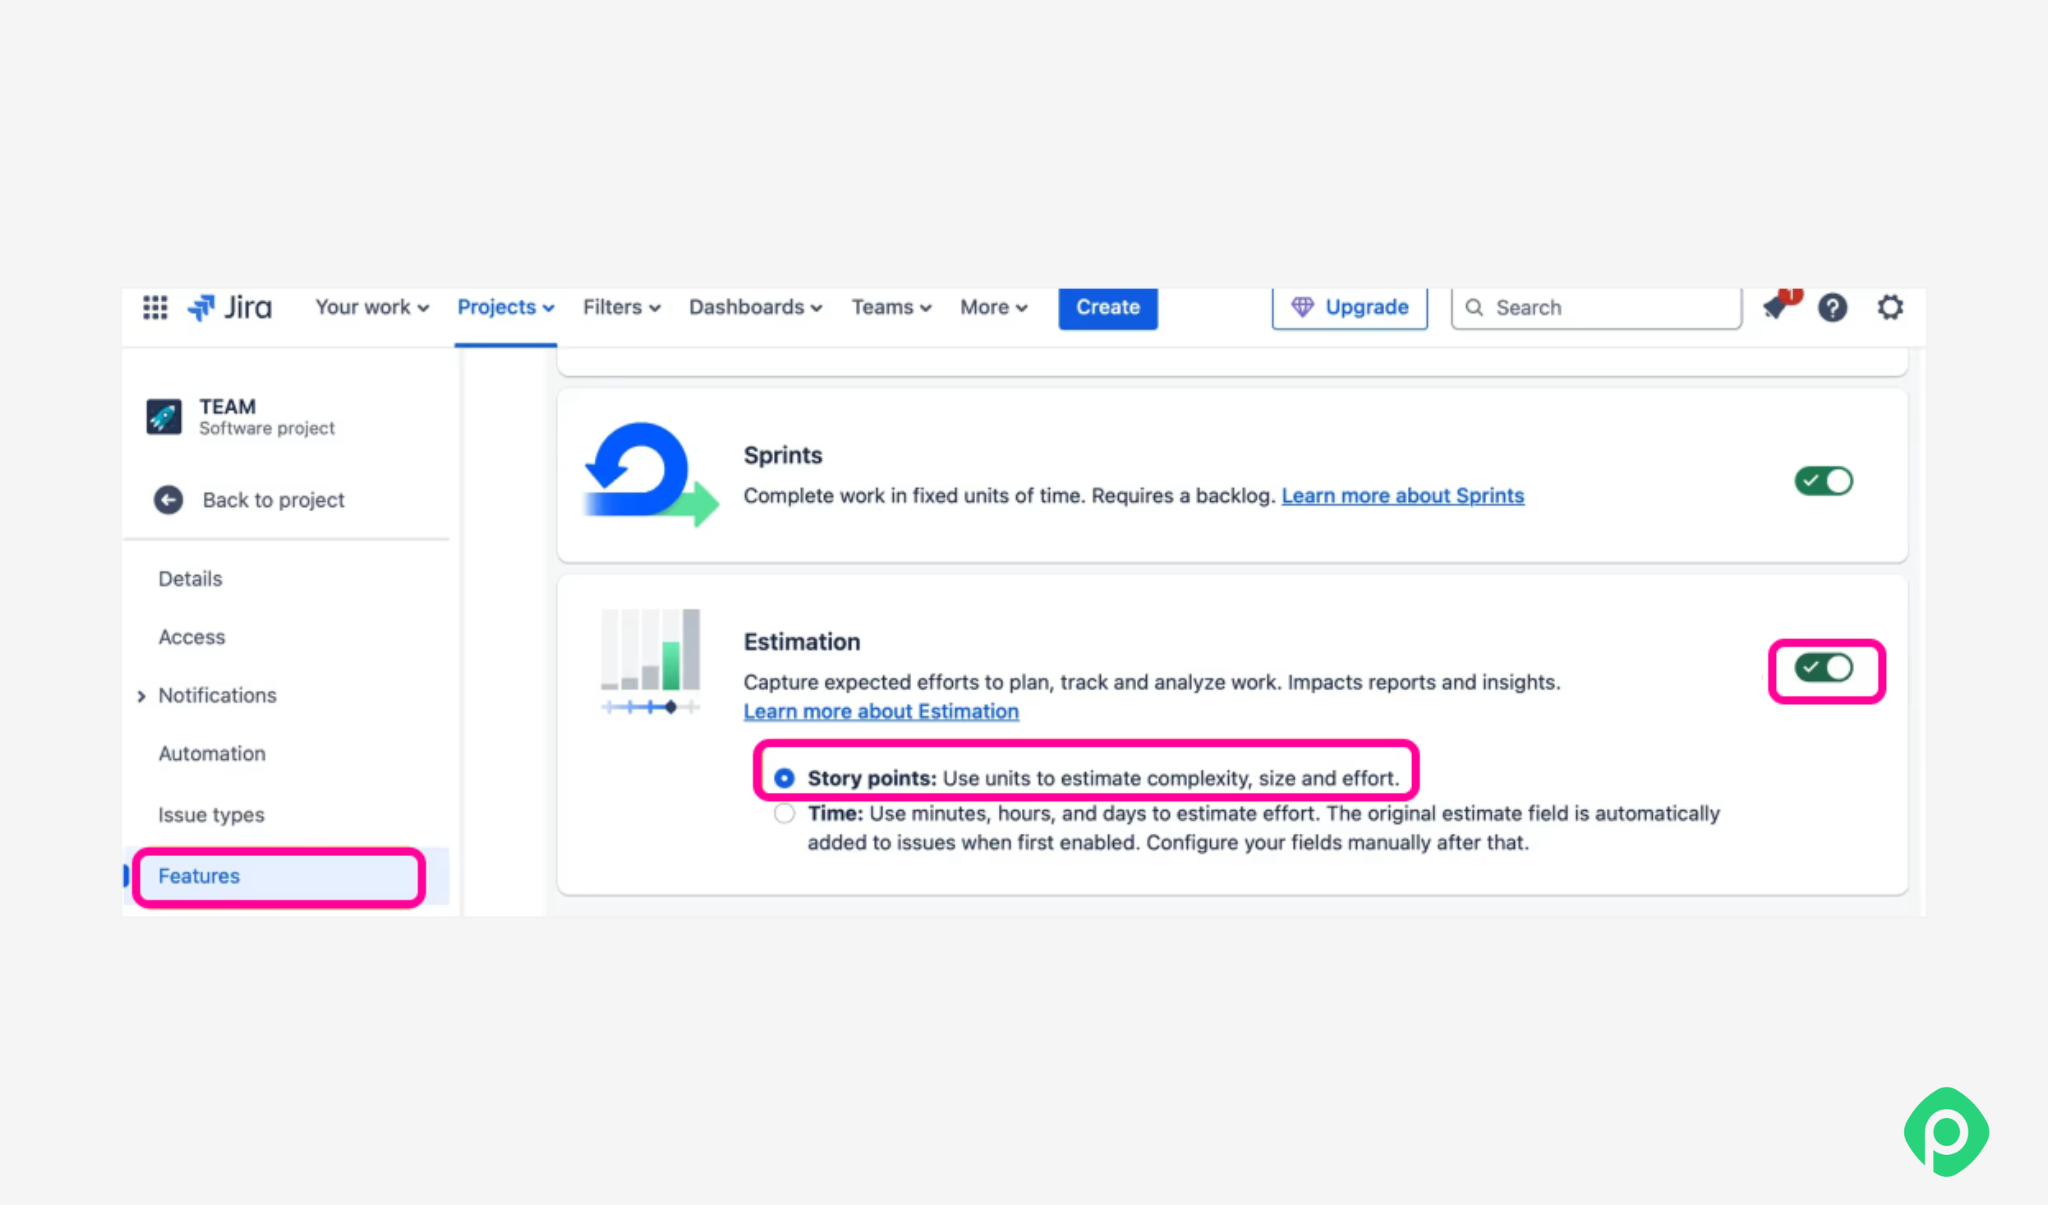
In a Team-managed Jira project, you'll find the toggle under Project settings → Features, where you can enable story points and pick “Story point estimate” as your default unit. In a Company-managed project, the field is called Story Points, and it usually has to be added to the board or issue layout before team members can add story points to any issue.
This isn't one story points field wearing two names — it's genuinely two separate fields. A dev team that estimates everything in one project type can't simply carry that history over if the project switches type later. Story points remain attached to the original field, and Velocity or Burndown charts that depend on it can come up empty until someone reconfigures the report.
If your entire scrum team plans to migrate between project types down the line, it's worth checking with an admin first.
Jira Story Points: everything you can do out of the box
Once story points are enabled, Jira actually gives you a fair amount to work with. Here's what's built in.
Estimate issues
Assign story points to backlog items right on the issue — how many points something deserves usually gets easier once a few reference tickets are already on the board.
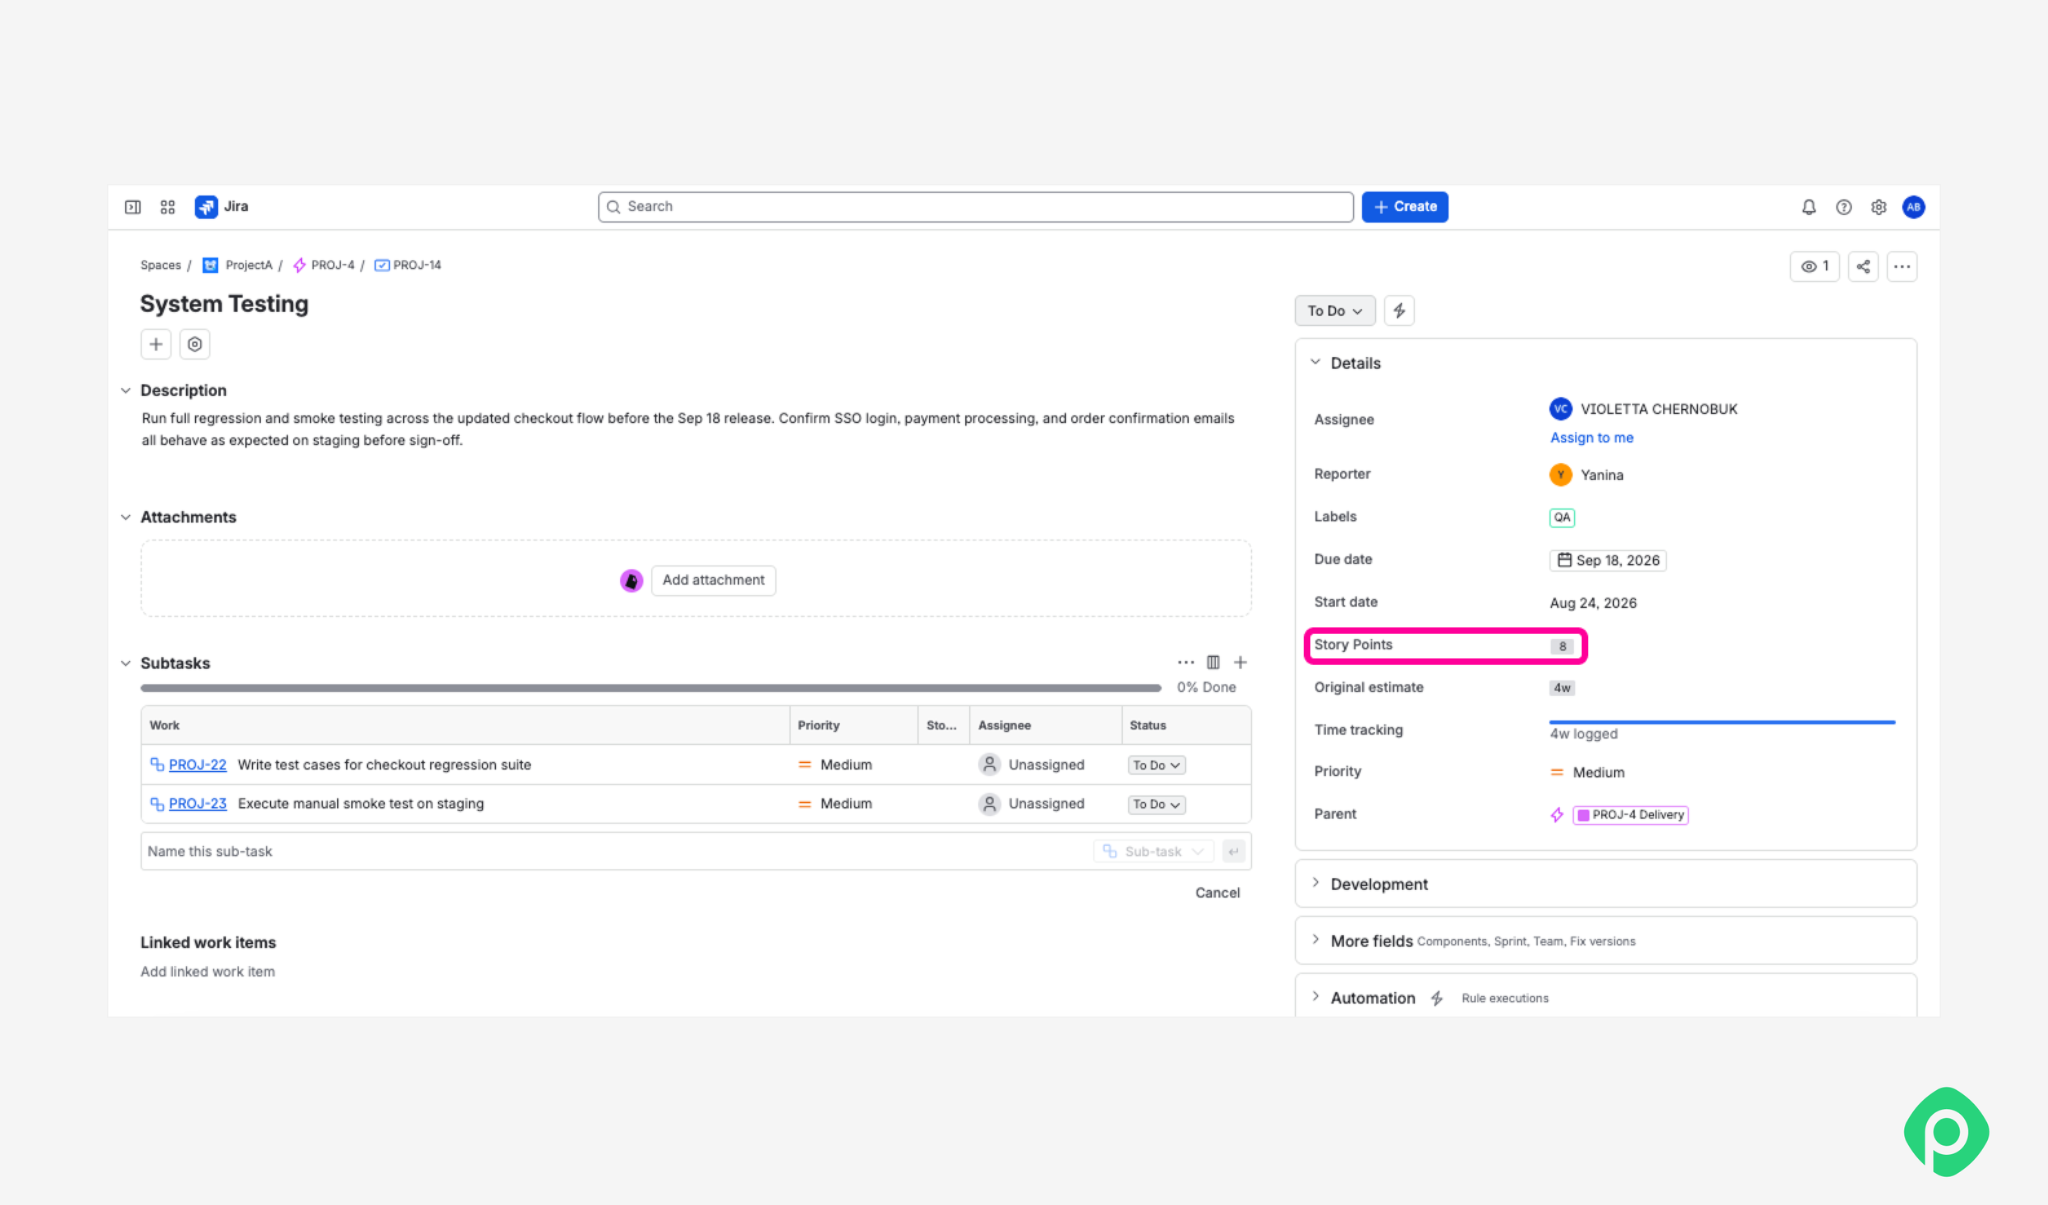
Consistency is the foundation of accurate story point estimation. Most teams aren't sizing new tickets from scratch but comparing them to something already estimated. The whole estimation process moves faster when there's a shared scale to lean on.
| Issue | Story Points |
|---|---|
| Fix broken pagination on the reports page | 2 |
| Add SSO login support | 5 |
| Rebuild the checkout flow | 8 |
| Migrate the notifications service | 13 |
Prioritize the backlog
Jira makes estimated effort easy to spot right in the backlog, giving teams a clearer sense of what’s ahead. For a product owner balancing priorities, dependencies, and business value, estimates are just one more piece of context to consider. Before the next refinement session, it’s often worth checking how many tasks still haven’t been estimated.
Plan sprints
This is where story points prove their worth for a scrum team sizing up what’s realistic for the next two weeks. Planning works best when the whole team chips in, rather than leaving it to the person running the meeting. If the team completed around 25 points last sprint and someone suggests taking on 60, take a look at this before the sprint begins. The math stays simple: Backlog → estimate → sprint commitment → delivery
Track progress
Once work is in a sprint, Jira's reports lean on story points completed rather than raw ticket counts. This matters, because ten small tickets and ten large ones don't represent the same overall effort. Development teams that track progress by points instead of ticket count get a more honest read on how the sprint is going.
How to go from story points to a realistic delivery plan
Jira lets you estimate issues, use those estimates for sprint planning, and track them through Agile reports. But it doesn't show whether that estimated work actually fits your delivery plan — across project dates, dependencies, and team capacity.
Planyway for Jira brings these pieces together, so you can see story-point estimates in the context of the actual plan.
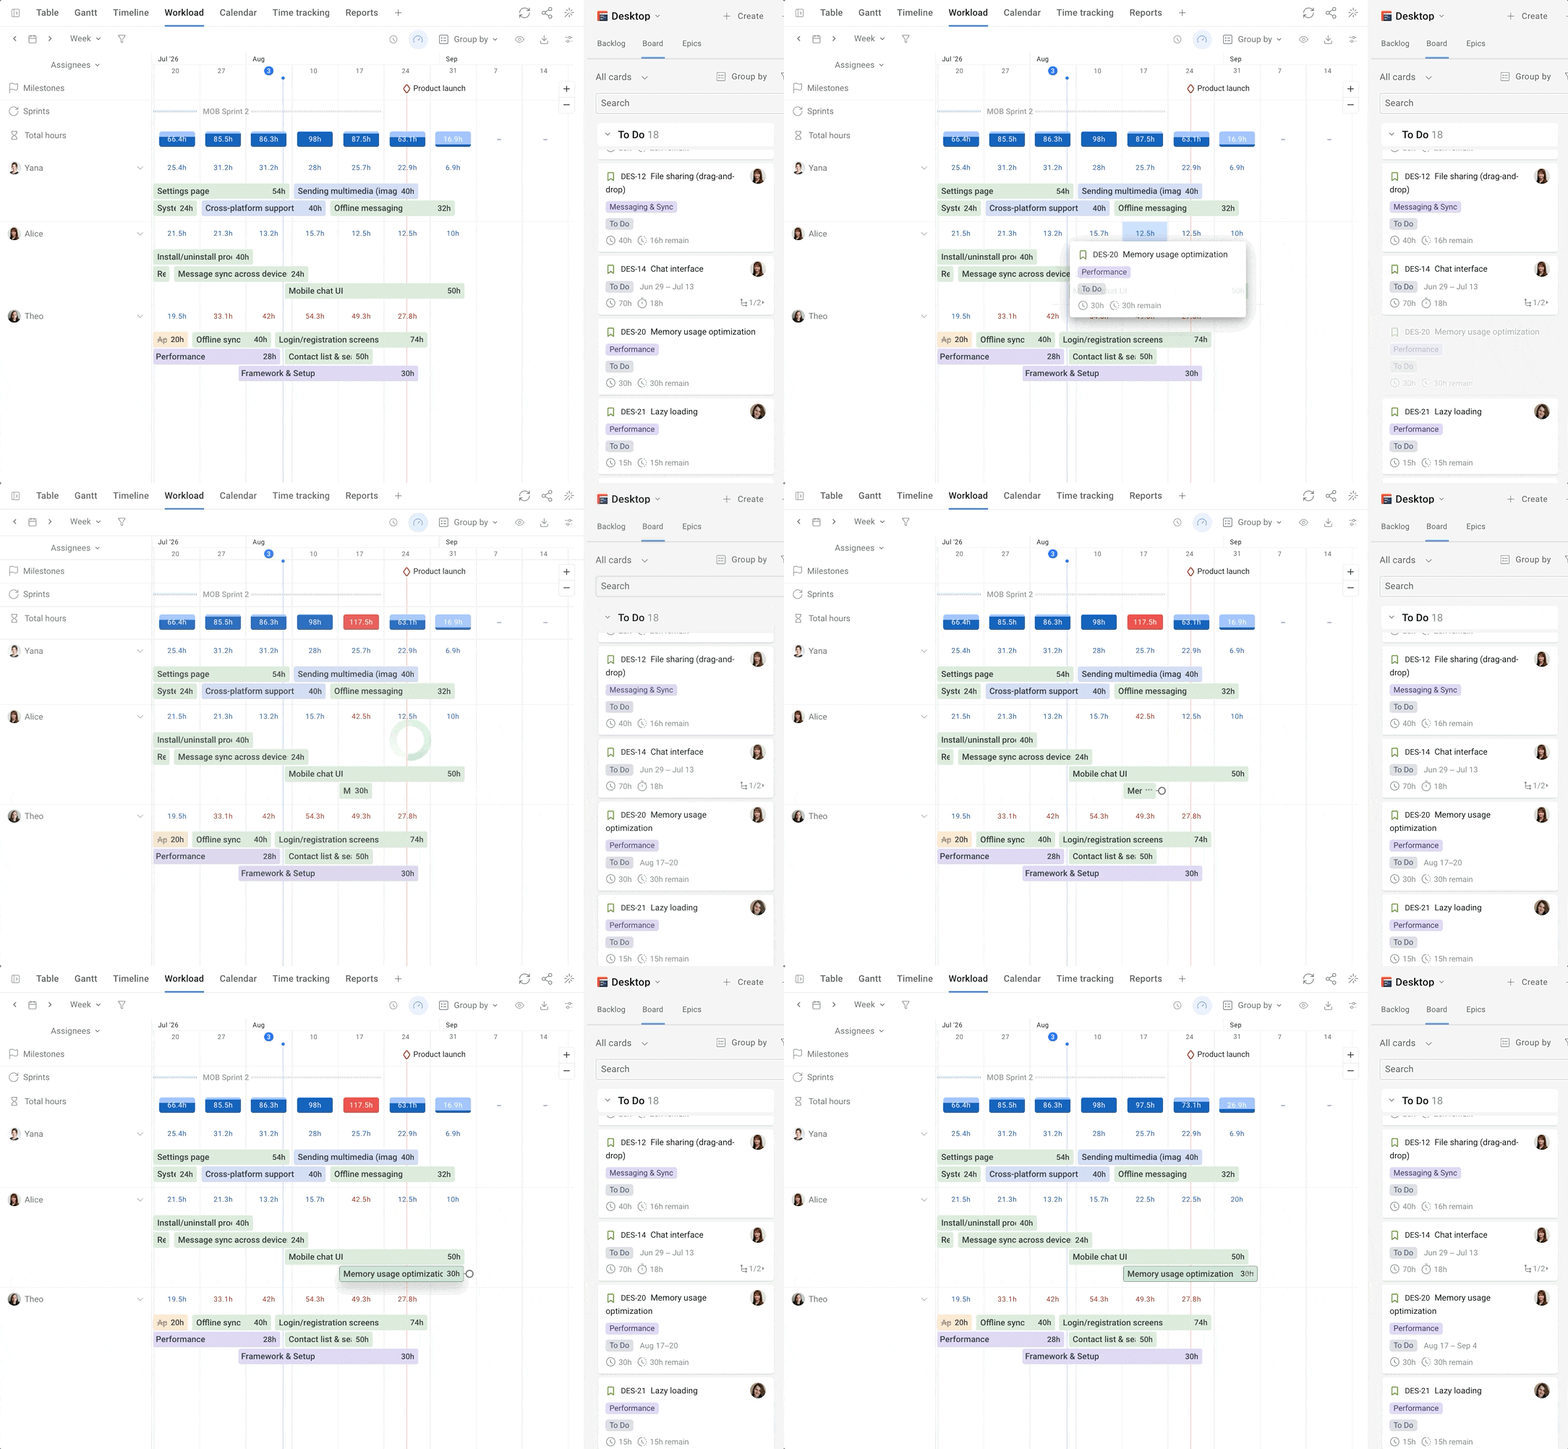
See story points on a timeline
Planyway puts Jira issues on a visual timeline, so story-point-based work sits next to real dates, dependencies, and the rest of the project plan.
Connect points with capacity
A story point tells you how much effort something takes, not whether the team actually has room for it. Planyway's workload and capacity views show how that estimated work is spread across people and projects, so overcommitment shows up before the sprint starts, not during it.
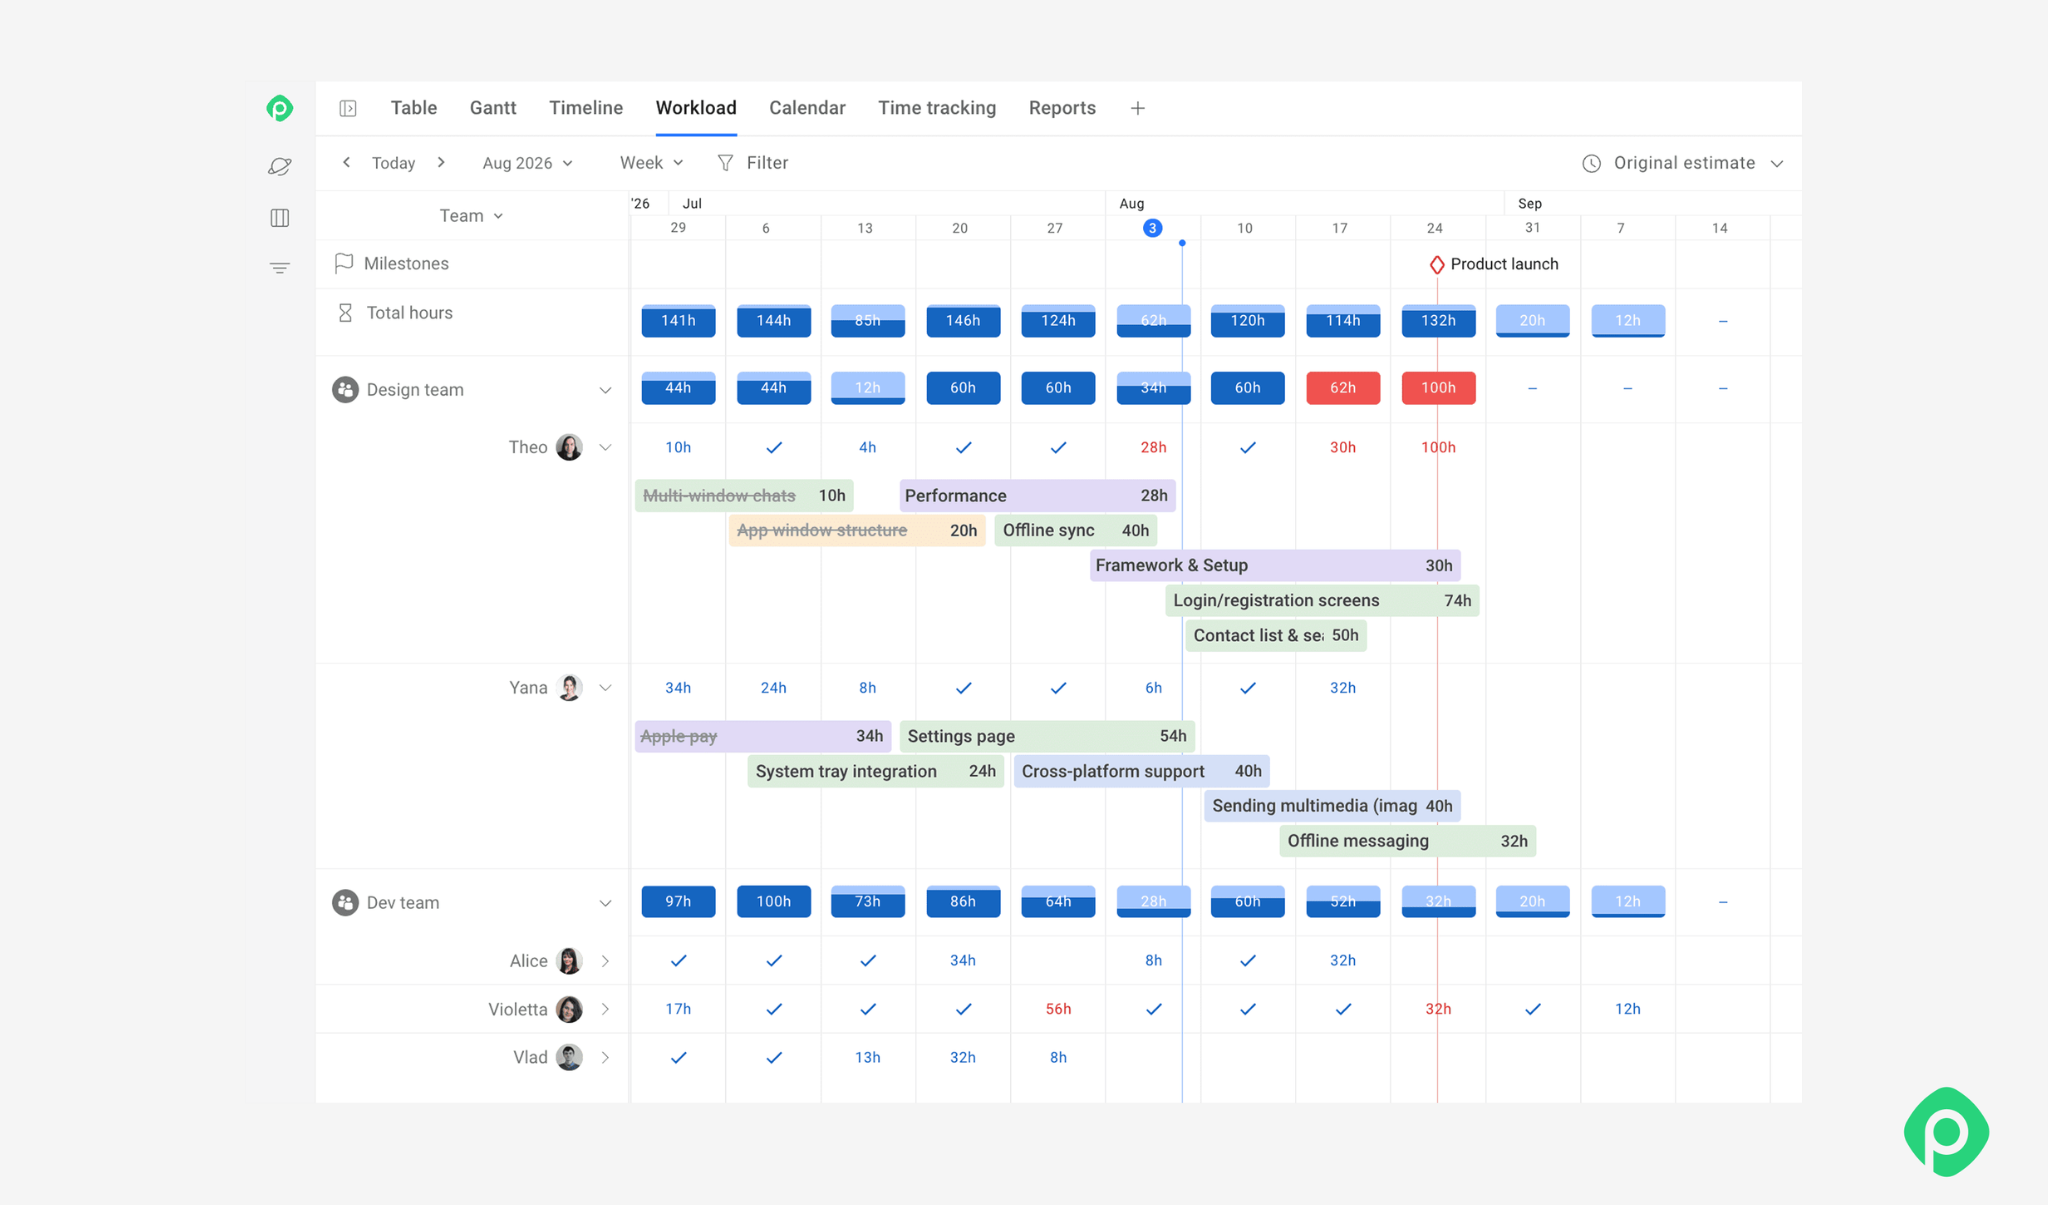
For a deeper look at how estimates translate into realistic team capacity, see our guide to Jira capacity planning and capacity planning in general.
Jira reports for Story Points
Jira offers several reports to track how Story Points move through a sprint and how much work the team delivers over time.
Velocity Chart
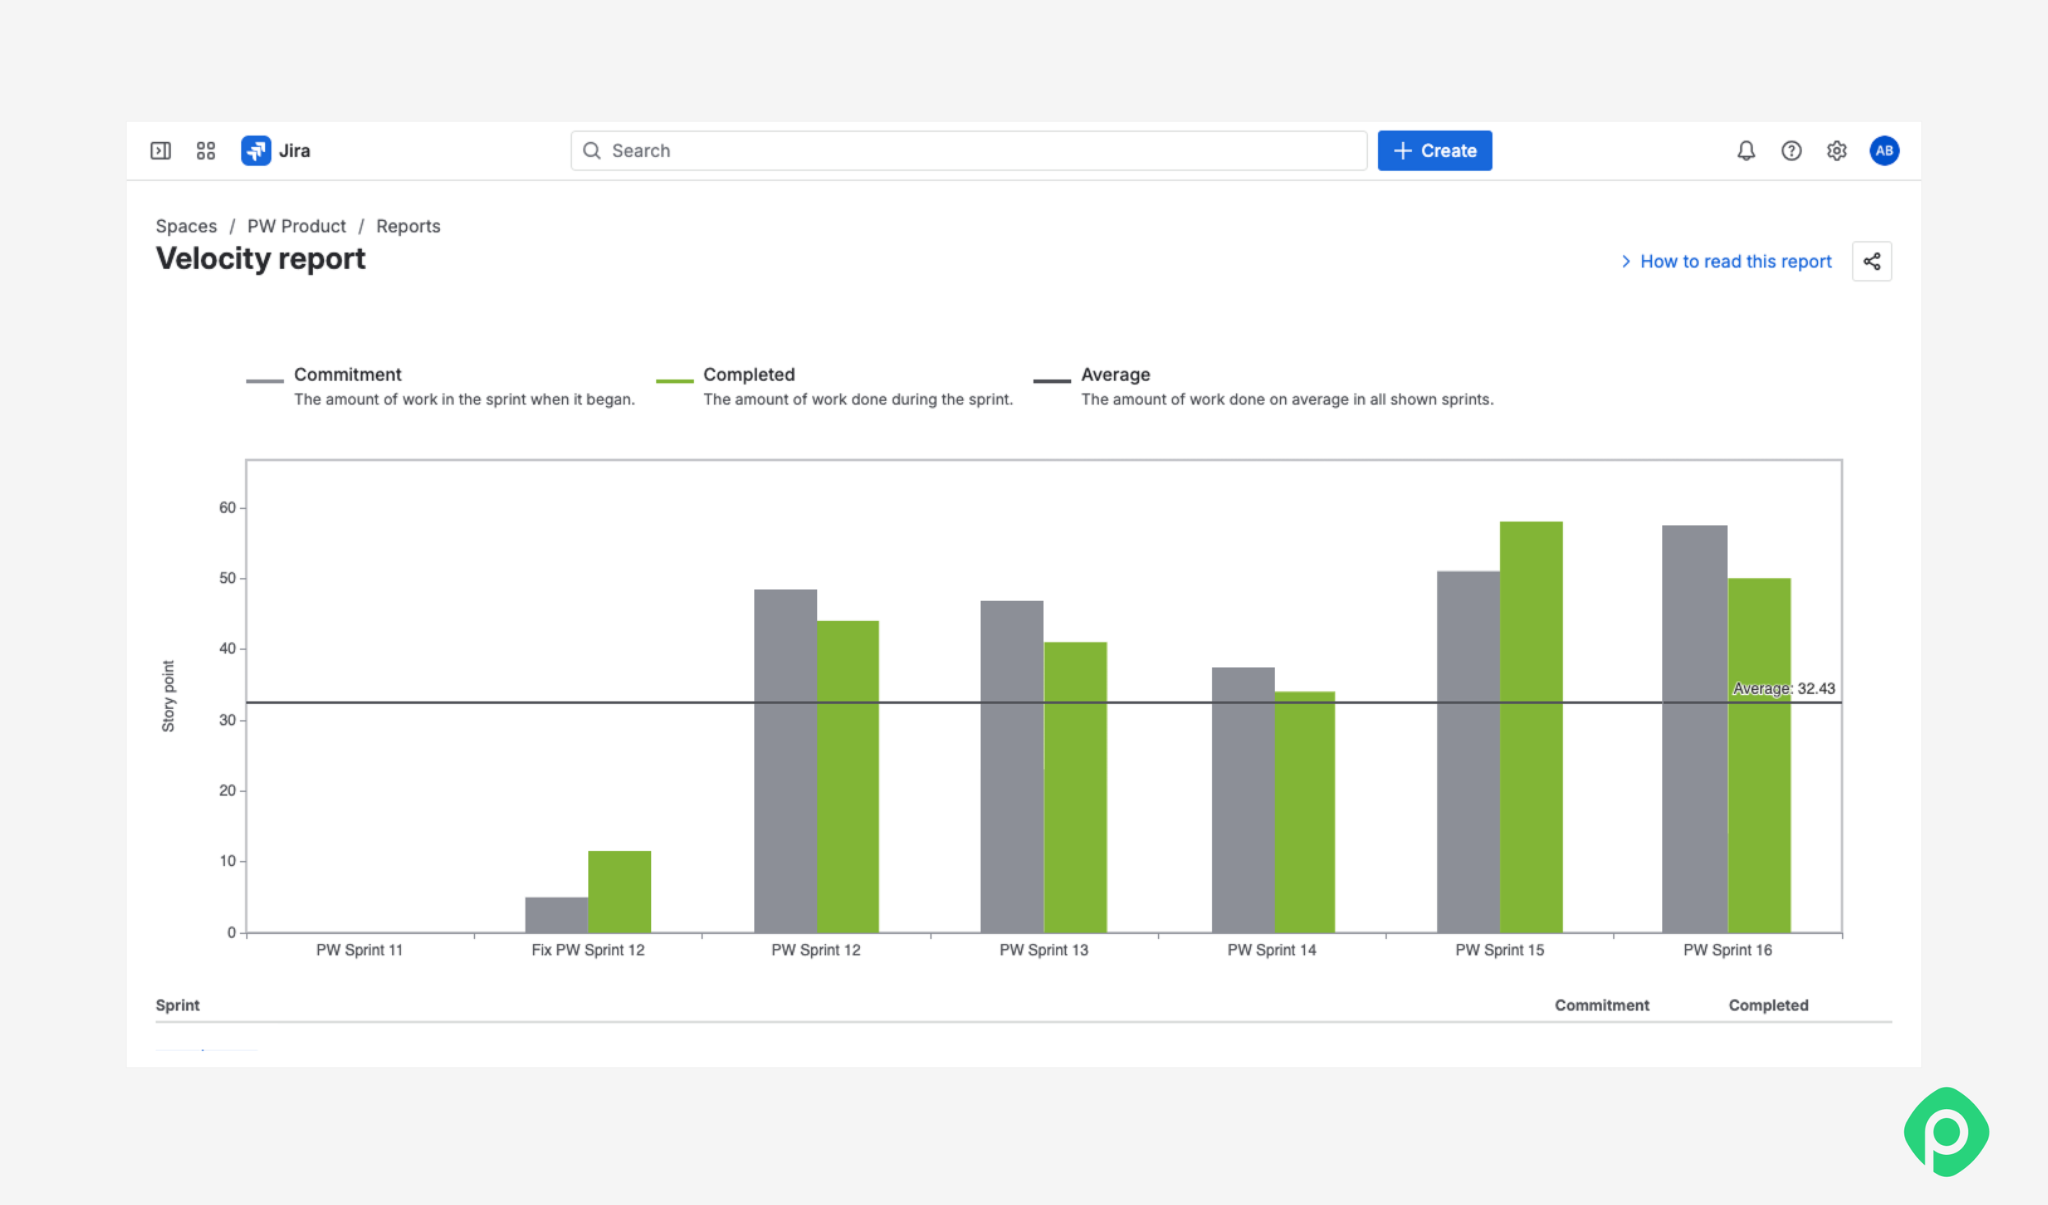
Shows completed story points per sprint over time, built from historical story point estimates. It's the main thing teams pull from when forecasting how much fits in a future sprint. Use it as a planning instrument specific to whoever generated it, not a ranking method: a velocity of 30 for one team says nothing about a team of 22 down the hall.
Note that points on sub-tasks don't get counted here — only parent issues do. If the number looks lower than what people remember shipping, that's usually why.
Burndown Chart
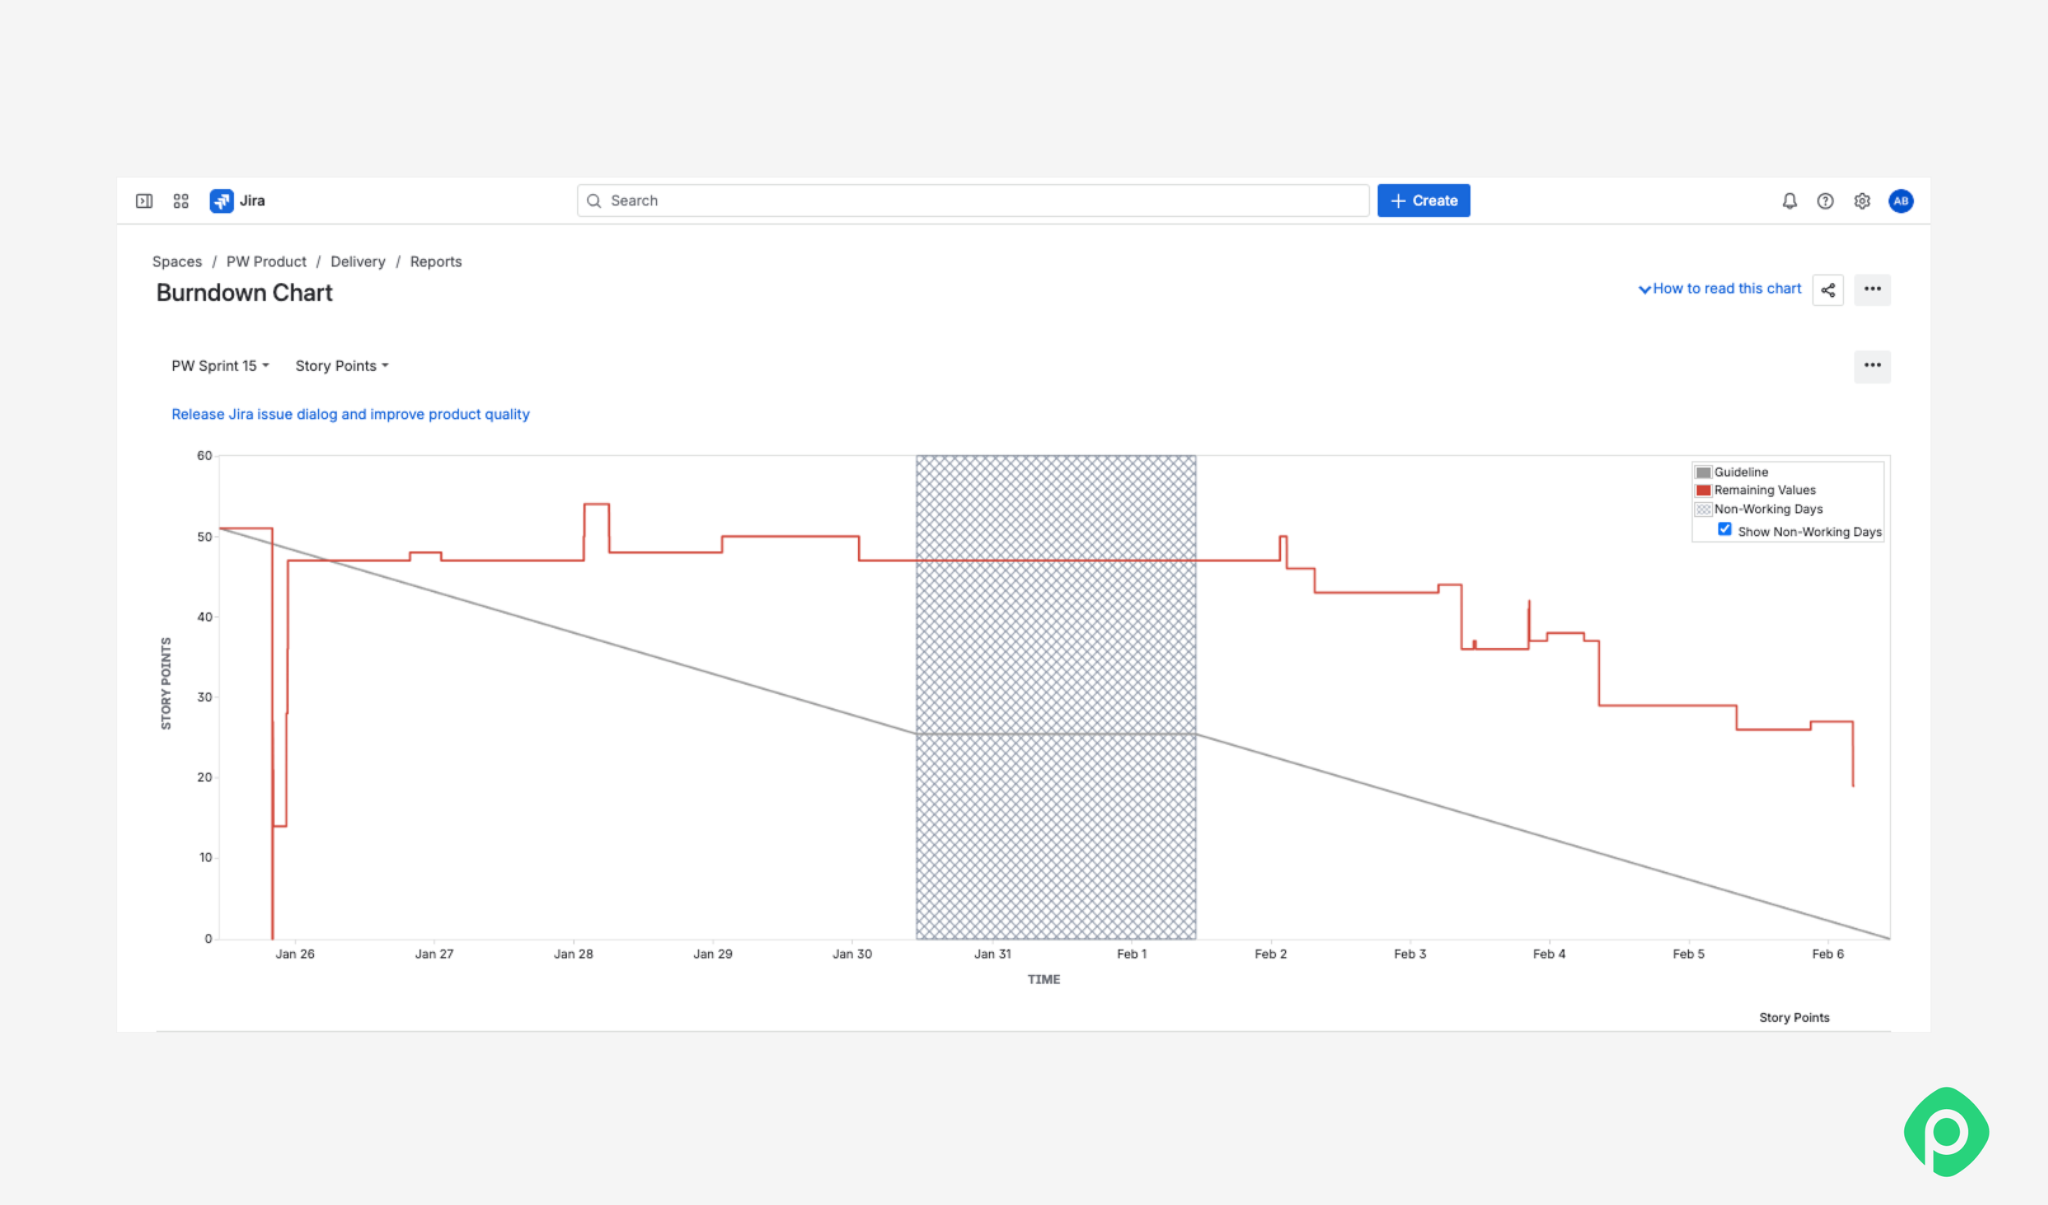
Tracks remaining work across the sprint. A flat line usually means work has stalled; a sudden jump usually means someone added scope mid-sprint.
Burnup Chart
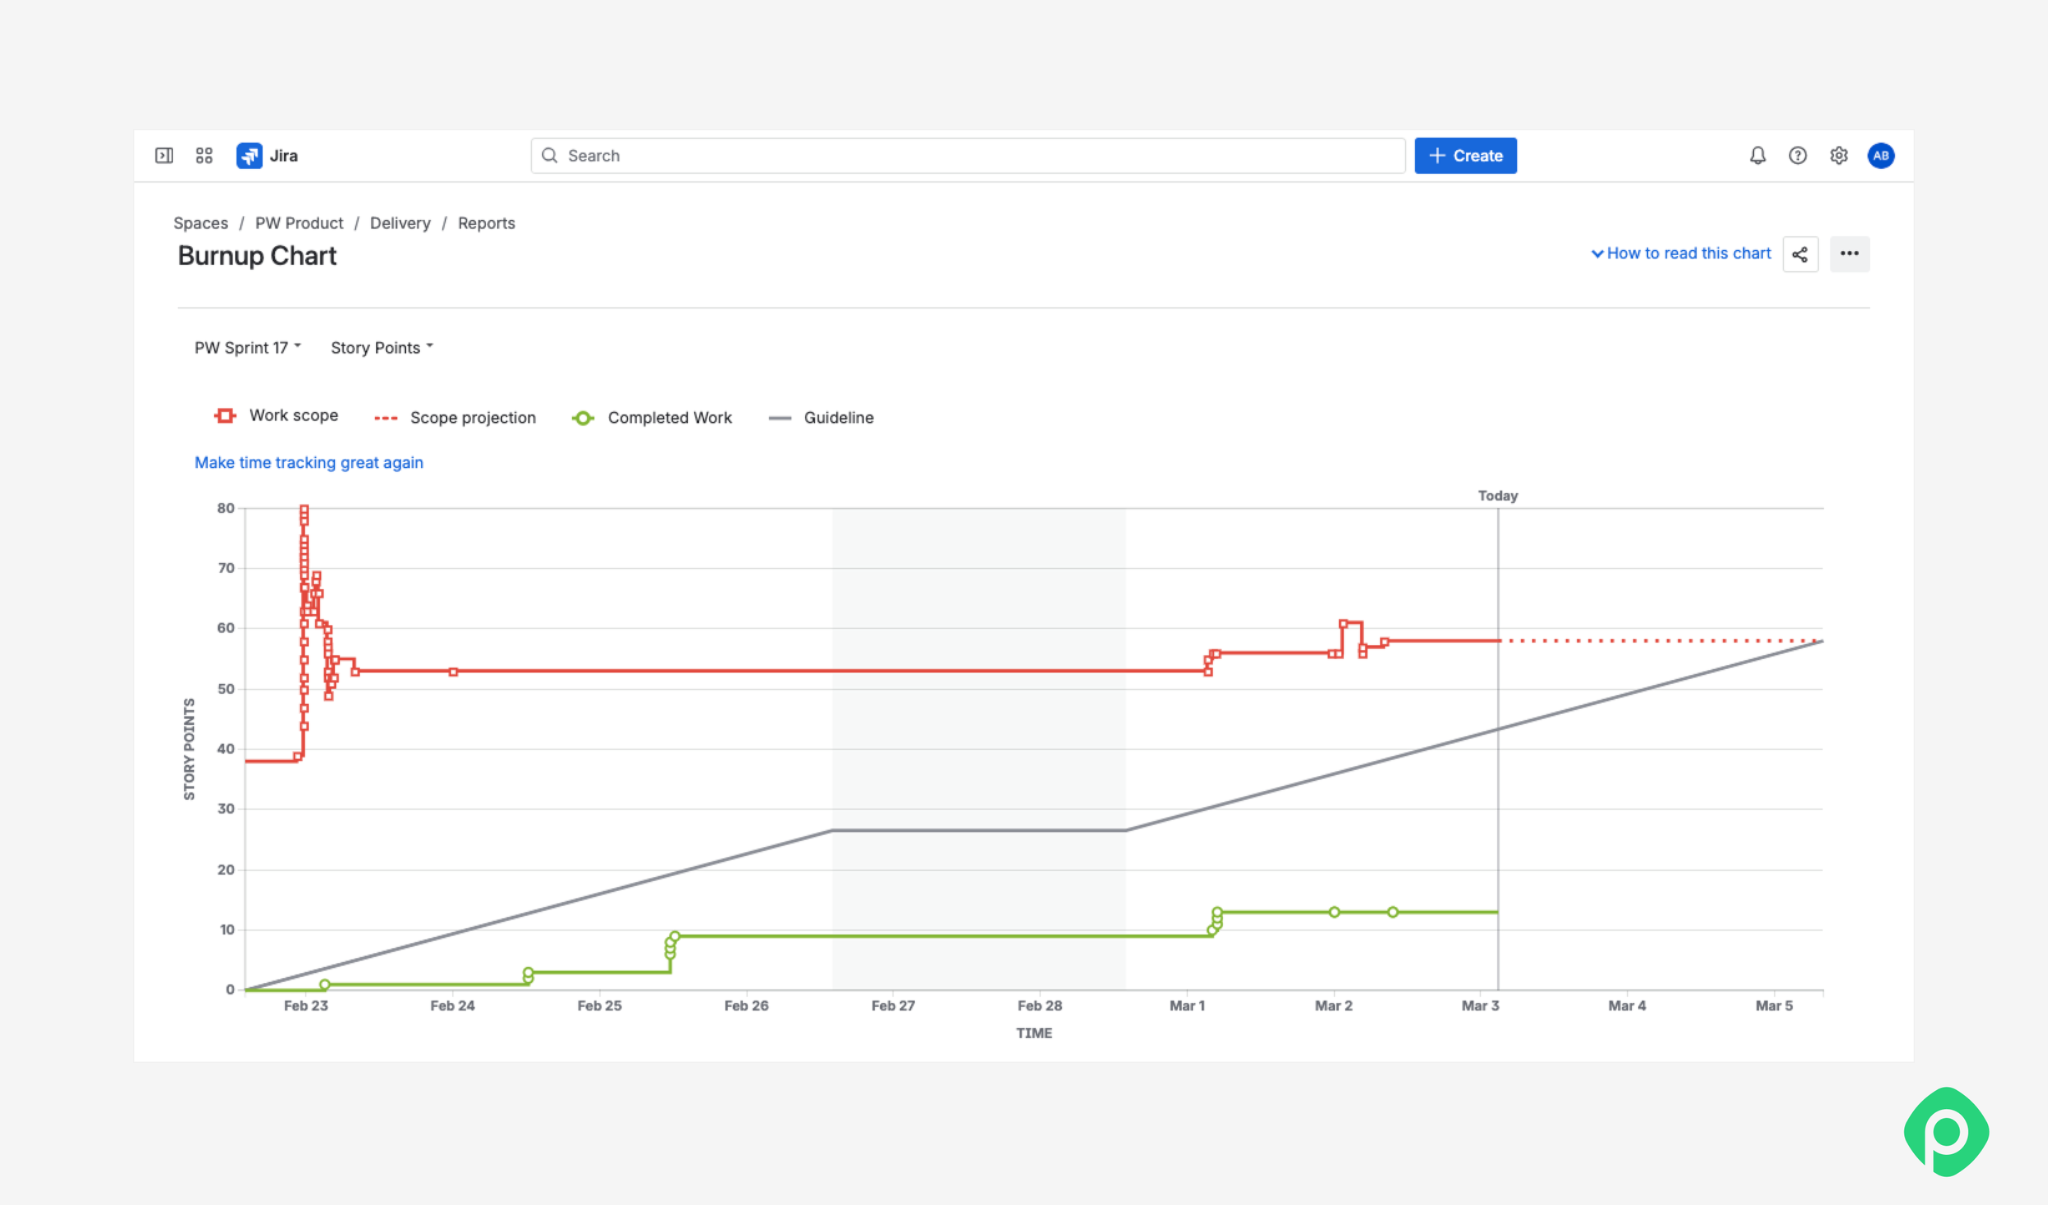
Same idea, opposite direction: plots completed work against total scope instead of what's left. It's the better pick when scope itself keeps shifting, since it shows progress and scope changes side by side instead of blending them into one line.
Sprint Report
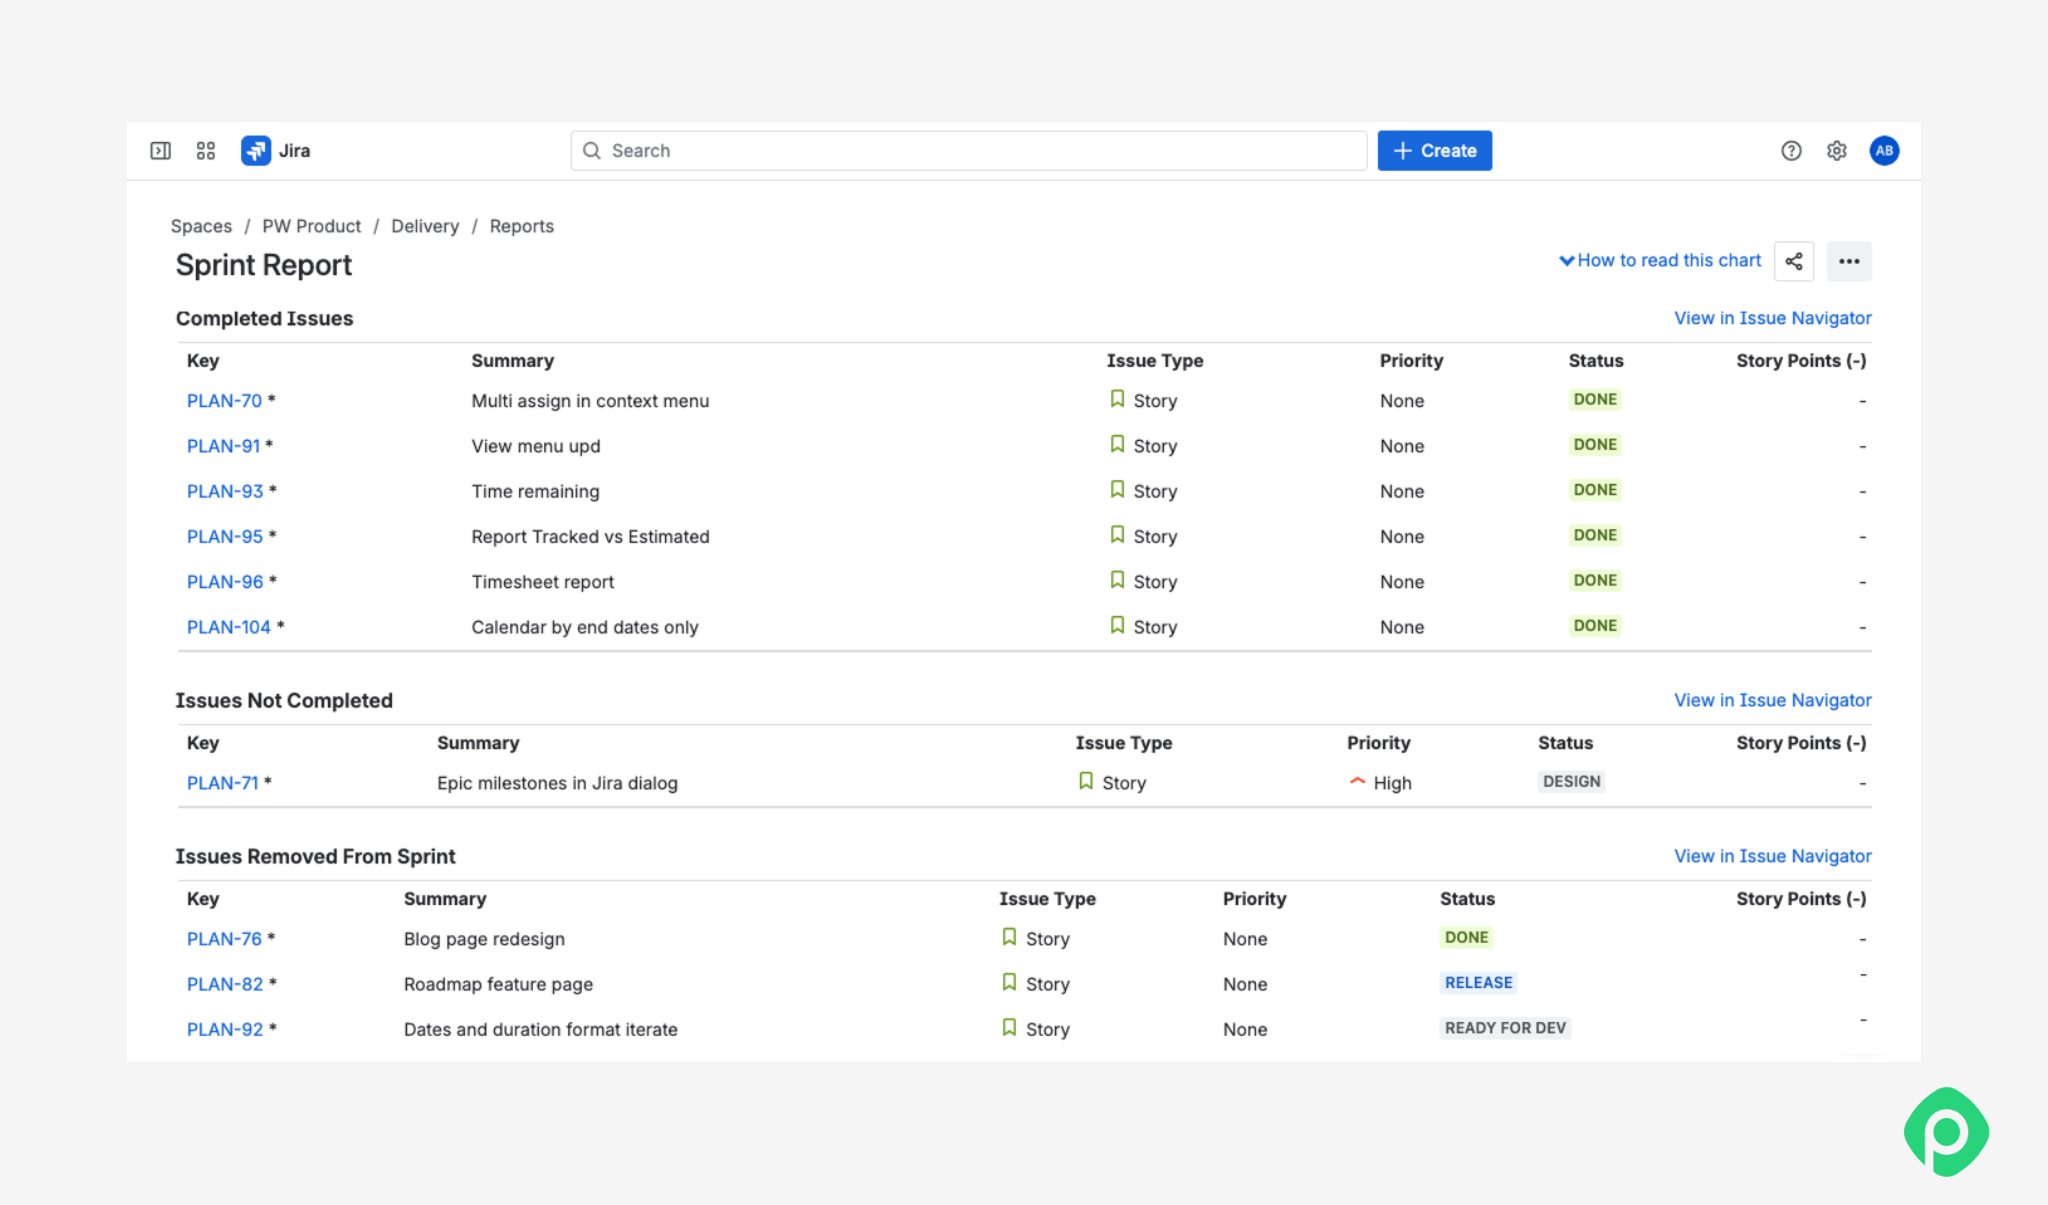
A look back at what got done versus what didn't, once the sprint closes.
Together, these four reports represent what story points provide beyond the planning session itself — a way to keep relative estimation honest against delivery data instead of guessing at time-based estimates every sprint. Story points matter most not during planning but months later, when someone needs to forecast the future.
How to estimate story points in Jira
There's no formula that spits out the right number for story point estimation in Jira. Again, the process boils down to building a shared understanding across the team, usually anchored by a handful of reference stories.
Run Planning Poker to reach an estimate
Planning Poker is the standard way most teams actually get to a number together. Here's how teams typically run Planning Poker: the team reviews the same Jira issue, each person chooses an estimate independently, and everyone reveals their number at the same time.
If two people land a card apart on the same story, the gap usually resolves itself once the team discusses what each person saw that the other didn't — each team member brings context nobody else has. If the spread is three cards or more, that's a sign the ticket isn't ready to estimate story points on yet. It needs another pass in refinement before anyone locks in a final estimate. Pairing story points with clear acceptance criteria before the session starts saves a lot of this back-and-forth.
Once the team agrees, enter the final estimate in Jira's Story Points field.
Use reference stories to calibrate estimates
Many Agile teams use a modified Fibonacci sequence: 1, 2, 3, 5, 8, 13 as their Story Point scale. The scale gives the team a shared set of values for expressing relative effort, while previously estimated issues provide the reference point for choosing between them.
For example, if a new Jira issue looks roughly twice as involved as a known 3-point story, the team might estimate it at 5 points. Over time, these reference stories help the team develop a shared understanding of what each point value means.
Story Points vs. hours: what should you use?
The obvious alternative to points is estimating everything in hours. Sounds easy: ask how many hours something will take, write the number down, done. Except that number depends entirely on who you ask.
Story points vs hours comes down to that distinction: hours tell you how long it took this specific person, while points describe how much effort the work represents, regardless of who picks it up.
Points hold up better across a backlog full of unfamiliar work. A ticket that looks small on paper but touches an unfamiliar system can eat a week, while a technically bigger one goes smoothly because the team's done it before. Time estimates invite false confidence in a way points don't.
None of this means hours are useless. Project managers juggling budgets and deadlines still need something concrete eventually, and converting story points into an hour estimate has its place later in the process.
Points aren't the only alternative to hours, either. Some teams reach for T-shirt sizing (S, M, L, XL). This feels looser, faster to agree on, and often a better fit for very early, rough sizing. It trades precision for speed. Fibonacci-style points ask for a bit more rigor, and work best once a team has enough reference tickets to calibrate against.
How to translate Jira Story Points into hours and client-friendly estimates
Clients rarely ask how many story points are left in the sprint. They ask when something will ship, or what it'll cost. Answering that well takes some care: it's easy to translate points into something concrete and lose the whole point of the system along the way.
Forecast delivery through velocity
Often the best answer doesn't need any conversion at all. Keep story points as the team's internal unit, and reuse the velocity math from the section above to turn remaining work into a timeline: 60 remaining points at a velocity of 30 points a sprint comes out to two sprints, or about four weeks. This covers most client conversations on its own.
Convert to hours, carefully
If someone specifically needs an hours-based number, historical data gives a reasonable estimate:
Hours per story point = Total logged hours ÷ Total completed story points
A team that logged 320 hours completing 40 points averages 8 hours per point. This captures their pace over that stretch and applies only to those months.
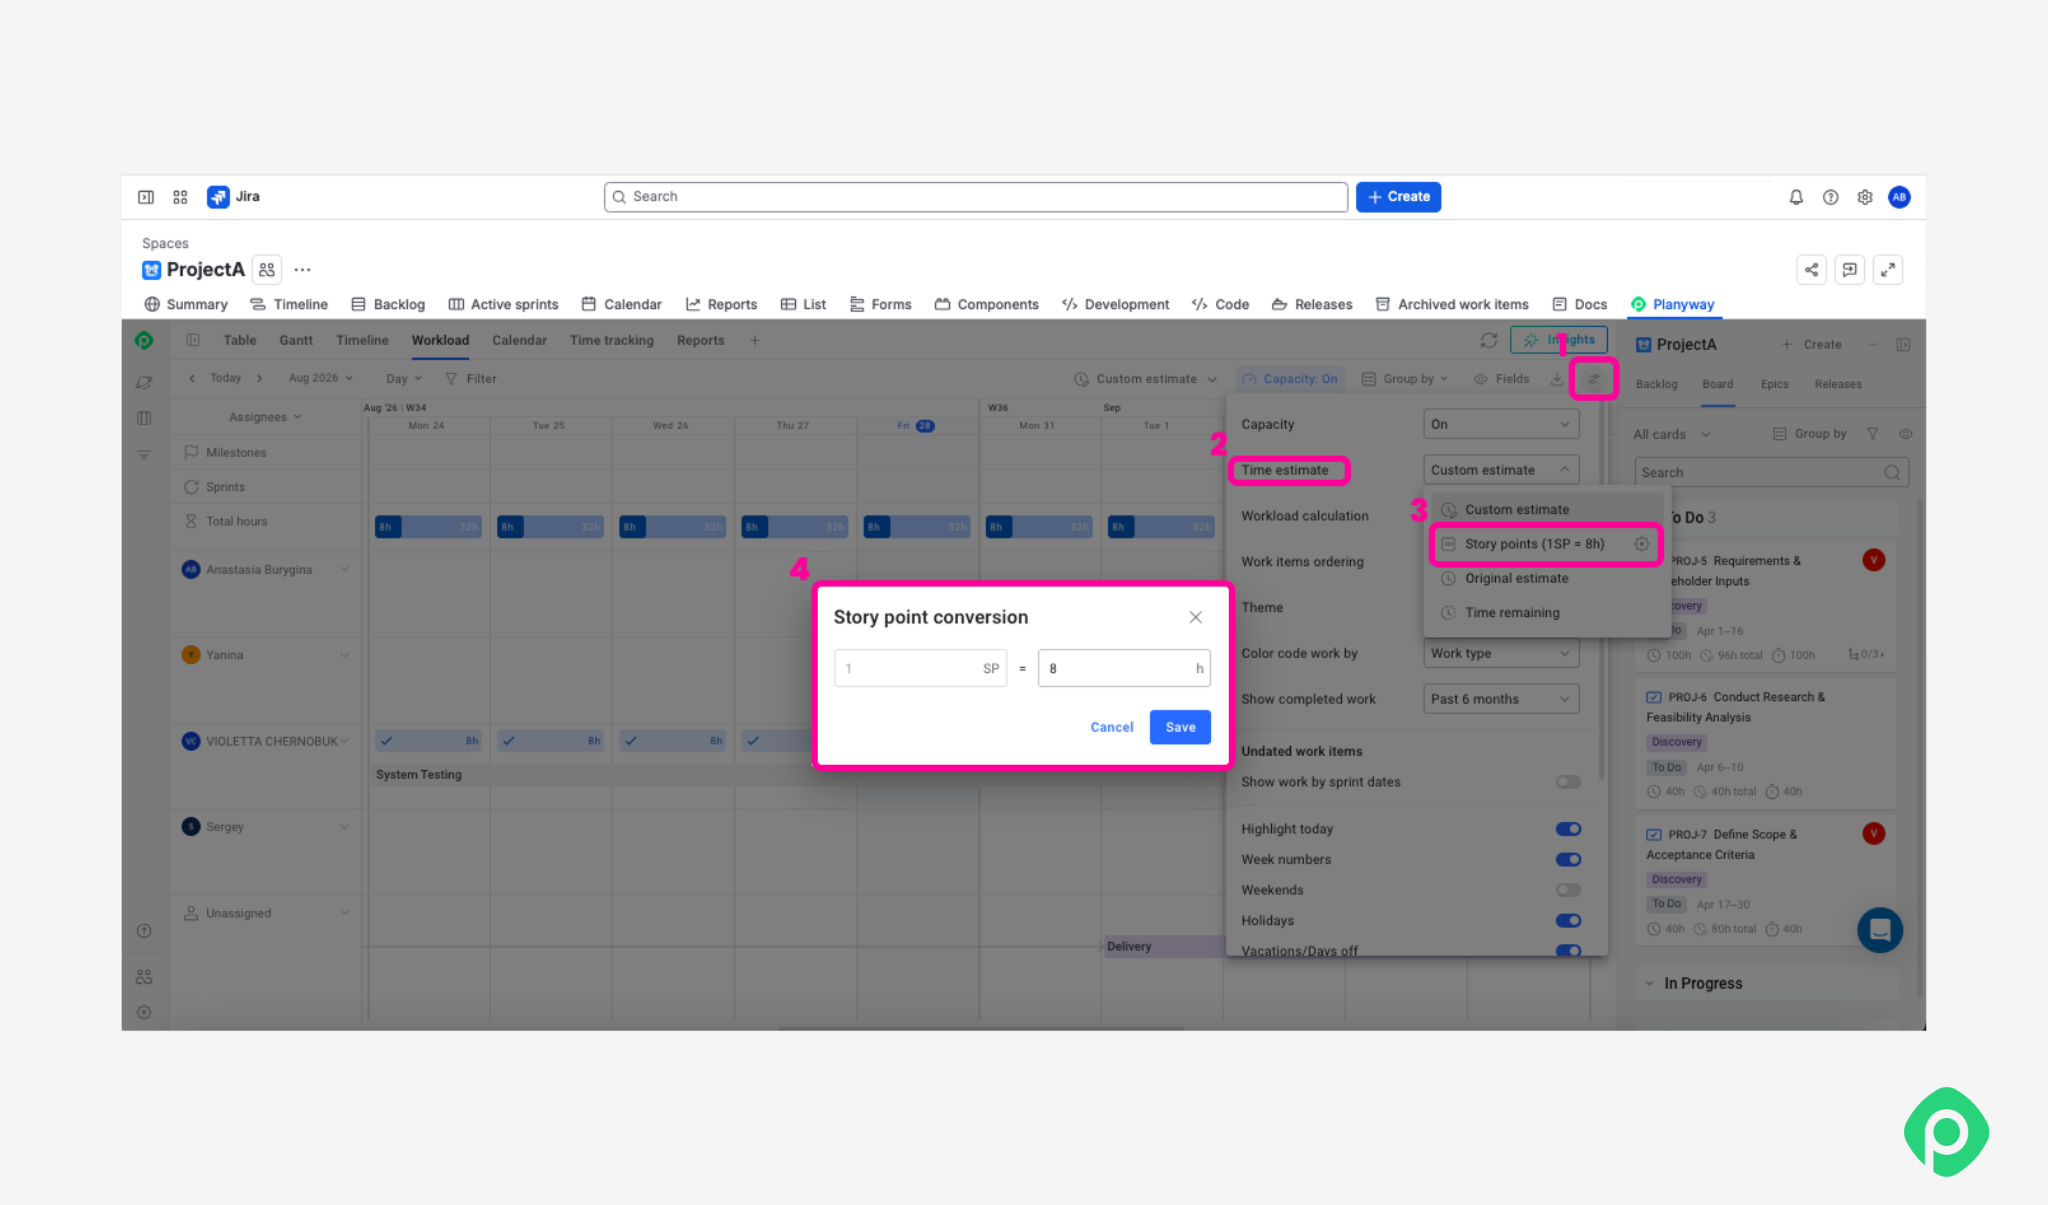
By the way, Planyway for Jira lets you set a custom story-point-to-hour conversion rate and shows that alongside the original estimate. You can then compare planned time against actual tracked time to see where the two diverge (also available in Planyway!).
Convert to cost
A team costing $50,000 a month that typically completes 50 points a month works out to roughly $1,000 per point — so an 8-point feature, think adding a third-party API integration, represents around $8,000 of delivery capacity.
Cost per story point = Team cost per month ÷ Points completed per month
Common Story Point mistakes to avoid
Most story point issues stem from what happens to the number later, rather than from the estimate itself. Here are the most common ones.
Treating one point as a fixed number of hours
If a team quietly decides "1 point = 6 hours" and never revisits it, points stop doing anything hours weren't already doing.
Turning points into a personal KPI
Once individual velocity becomes something people are measured against, speed starts winning over quality. It also stops working as a way to compare people. If everyone closes 8 points a sprint, that says nothing about who's actually more capable. And it kills collaboration, since helping a teammate doesn't move your own count.
Hitting your estimate every time isn't automatically good news
Ron Jeffries, who helped bring story points into common use, remarked that a team meeting its estimate every single sprint often inflates its figures. Fluctuation in delivery is a hallmark of genuine estimation; unwavering accuracy raises questions.
Estimating subtasks instead of the story
Estimating backend, frontend, and tests as discrete tasks offers apparent granularity. Those subtasks carry no standalone value, and Jira's built‑in velocity metrics exclude them altogether. Base the estimate on the story itself rather than on its individual components.
Comparing velocity across teams
One team's 3 often equals another's 5 — two teams rarely land on the same value for identical work, given different tooling and conventions baked into the scale. That's fine internally but breaks down the moment two teams' velocities get compared directly. A handful of shared baseline stories can anchor comparisons across teams without forcing identical numbers.
Rewriting the estimate after the fact
If a story spills into the next sprint, don't bump the point value to match what happened. That erases useful information about why it was underestimated in the first place.
Economists call this pattern Goodhart's Law: “When a measure becomes a target, it ceases to be a good measure.” Story points work as a planning tool. When they become a target, they stop measuring anything real.
The bottom line
Story points offer teams a common vocabulary for effort estimation without committing to hour‑level precision. Jira supplies the operational backbone — estimation workflows, sprint planning, velocity‑based forecasting. The rest falls to practice: maintain relativity, decouple points from hours and from individual assessment, and calibrate across teams rather than ranking them.
For mapping those estimates against deadlines, team capacity, and logged time, Planyway extends Jira's built‑in reporting with a dedicated scheduling layer.


FAQ
The Fibonacci sequence is used for story points by assigning each backlog item to the nearest value in the sequence (1, 2, 3, 5, 8, 13...) instead of a straight 1-through-10 scale. The gaps widen on purpose — teams can reliably tell a 2 from a 3, but rarely a 12 from a 13, so there's no point arguing over precision the estimate can't actually support.
Story points are used instead of hours because hours measure how long a specific person took, which shifts with experience and familiarity with the codebase. Story points measure effort relative to other work, so the number stays useful no matter who ends up picking up the ticket — that's really the key takeaways story points offer over hours: effort stays about the work, not about who's doing it.
0.5 story points are used by some teams for genuinely trivial work that's still worth tracking, though it's the exception rather than the norm. If half-points start showing up often, that's usually a sign 1-point stories need to be broken down further, not that the scale needs more precision.
Jira story points are used for sizing backlog items, deciding how much work fits in a sprint, and forecasting delivery from historical velocity. They also feed Jira's built-in reports — Velocity, Burndown, and Burnup charts all depend on them.
One story point in Jira has no fixed value — it only means something relative to a team's own reference stories. The same ticket could be a 2 for one team and a 5 for another, and both would be correct within their own scale.