Shewhart Control Chart: An Essential Tool for Quality Management
5 min read
Shewhart Control Charts, also known as control charts, are a fundamental tool in statistical process control (SPC). They are widely used in manufacturing and production environments to monitor and control processes, ensuring that they operate at their full potential.
What is a Control Chart?
Control charts are graphical tools used to determine whether a manufacturing or business process is in a state of control. They help in identifying variations that occur in the process over time. These charts enable managers to distinguish between common cause variation (natural variation inherent to the process) and special cause variation (variation caused by specific, identifiable factors).
Control Charts: Usage Example
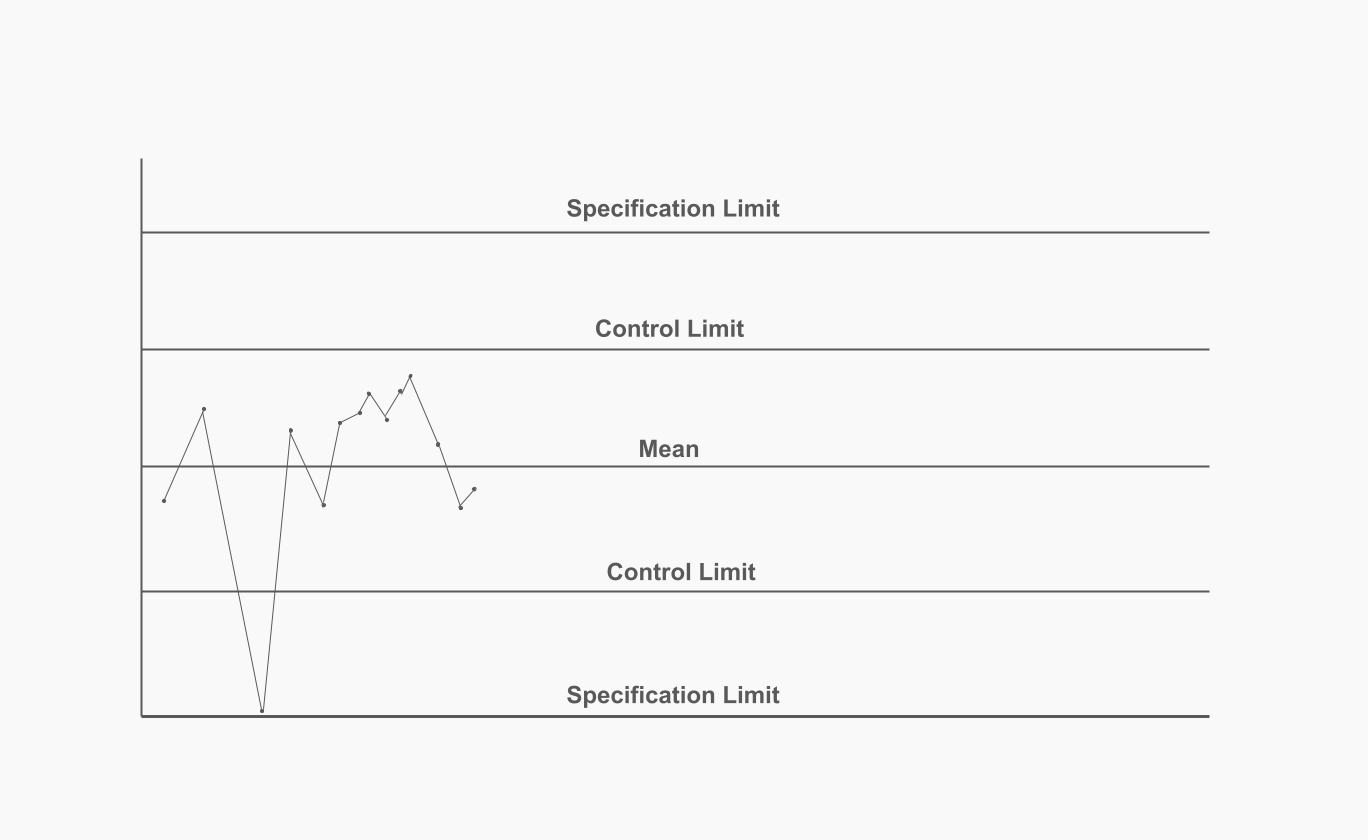
Imagine you have a series of repetitive operations. For instance, you manage a project involving 500 sites, each requiring a team to arrive, unload equipment, connect it, test it, migrate data, and so forth. For the first 20 sites, you've collected data and experimentally determined that, on average, it takes 4 hours per site. You then create a Shewhart control chart (see image above) to monitor if everything is proceeding as planned and if any anomalies arise that require intervention.
Specification Limits
You also know that it is physically impossible to complete the implementation in less than an hour. Therefore, any implementation that takes less than an hour indicates a problem. This time threshold represents your lower specification limit on the control chart.
On the upper end, your contract stipulates that no implementation should take more than 8 hours. Exceeding this time frame could result in penalties. This represents your upper specification limit. The average time of 4 hours lies in the middle of these limits.
Control Limits
The most critical aspect of control charts is the control limits, which are narrower than the specification limits and closer to the mean. These limits are calculated based on standard deviation and represent the range within which the process naturally varies. The calculation of these control limits is complex and depends on various factors. Detailed information on calculating deviations can be found in the ISO guideline.
Purpose of Control Charts
Once all the values are plotted on the chart, and your teams continue to perform the implementations, you continuously add new data points to the chart. The vertical axis represents the duration of the implementation, while the horizontal axis represents the sequence number of the implementation.
If any implementation breaches the specification limits, it signals a significant problem. Similarly, breaching a control limit also indicates an issue, suggesting that the deviation is not random and requires investigation.
Rule of Seven
One of the most interesting aspects of control charts is their ability to detect subtle problems. For instance, the "Rule of Seven" states that if there are seven consecutive data points on one side of the mean, it is not a random variation. This indicates a change in the process, such as a team member falling ill, the team starting to cut corners, or clients taking more time for approvals.
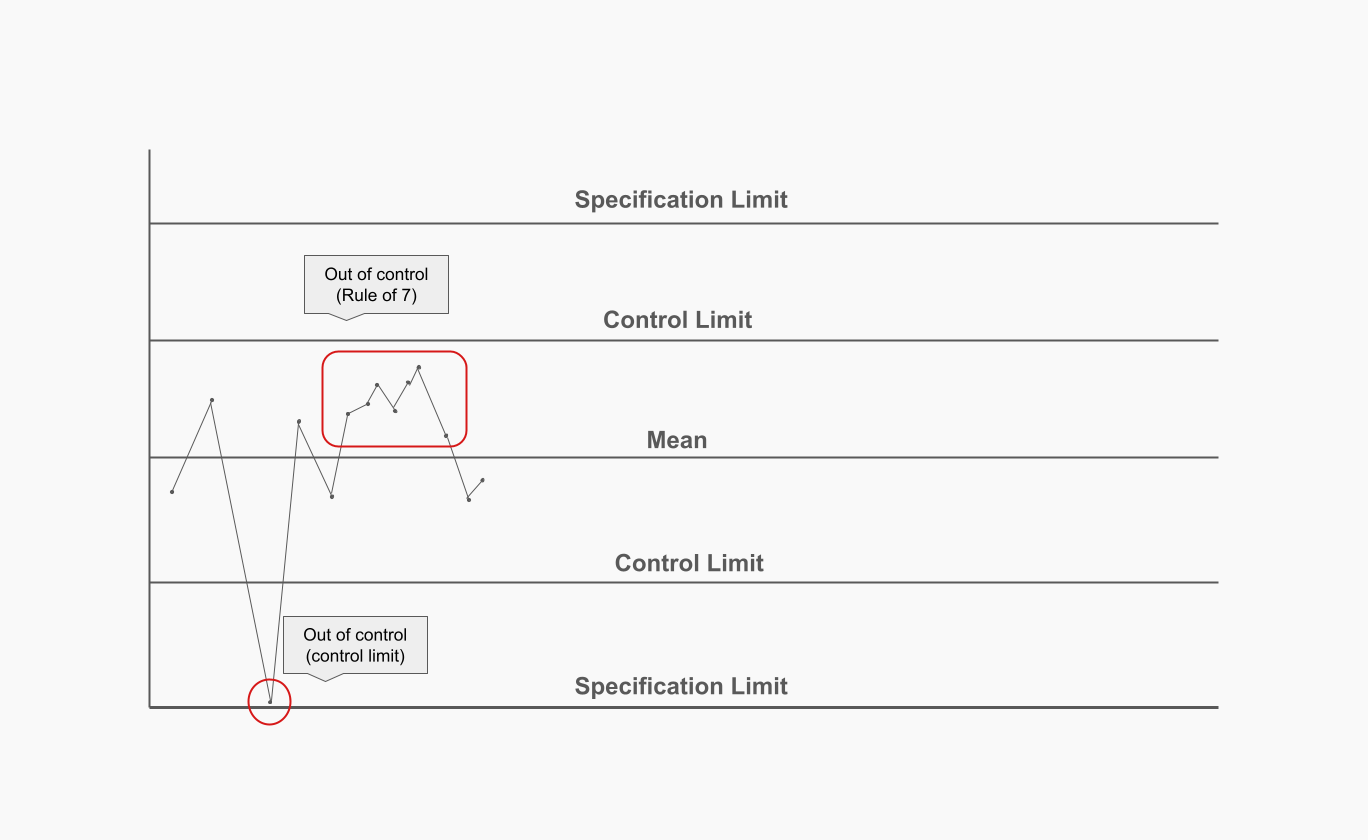
Control charts, therefore, can signal potential problems before they become significant issues, allowing for proactive measures.
Practical Use
However, the entry threshold for using this tool is quite high, and its applicability varies significantly between project managers and production managers. While project managers might find limited use for Shewhart chart, produhttps://planyway.com/blog/project-management-guidection managers can greatly benefit from their implementation.
Conclusion
Shewhart control chart is a powerful tool for monitoring and controlling processes, particularly in production environments. It helps identify variations, enabling managers to take timely action to maintain quality and efficiency. By understanding and implementing SPC charts, managers can ensure that their processes remain stable and predictable, ultimately leading to improved productivity and customer satisfaction.
About the Author
Sergey Koshevoy is the CEO of Planyway and a seasoned product manager, crafting insightful and engaging articles on productivity and project management. With his wealth of experience in project management, he ensures that every piece of content is both informative and inspiring, helping readers optimize their workflows and stay ahead in their projects.