The Pareto Chart and the 80/20 Principle: A Practical Guide
5 min read
In this guide, we will delve into what a Pareto Chart is, provide a practical example, and offer step-by-step instructions for creating one in Excel.
What is a Pareto Chart?
The Pareto chart correlates with the Pareto Principle, also known as the 80/20 rule. This principle states that a smaller number of causes often lead to a larger portion of the effects. In simpler terms, roughly 20% of the causes are responsible for 80% of the consequences.
The Pareto chart is a tool based on this principle, combining histograms and line charts. It helps us identify and focus on the most significant problems from a large set. The chart consists of bars showing the frequency of issues and a line representing the cumulative percentage of these issues.
Pareto Chart Example
Let's illustrate this with an example. Suppose we have a call center that receives numerous customer inquiries. By analyzing these inquiries with a Pareto Chart, we might discover that a significant portion of them revolves around the same few issues.
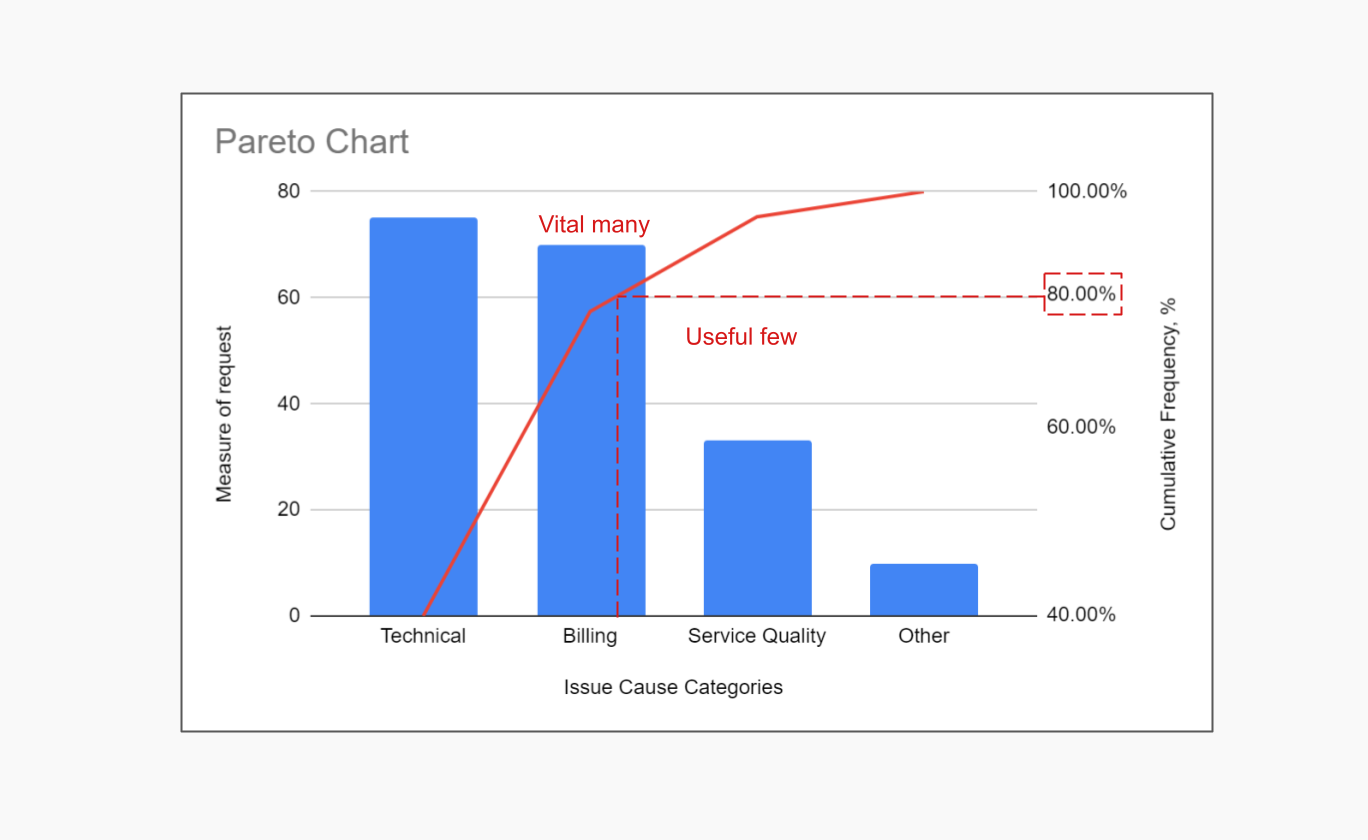
To get started with the Pareto Diagram, you need to list all the inquiries and group those that have similar causes. Then, we list the causes of the inquiries on the horizontal axis of the diagram, while the vertical axis shows their frequency. An important step before creating the Pareto chart is to order the causes by their frequency.
The result is a bar chart (histogram) at the bottom, overlaid with a line chart. The bars represent the percentage of users who report the same issue. The line chart accumulates these percentages progressively.
By examining the Pareto chart, we can find the point where the line reaches 80% (or a nearby value) and identify which problems to prioritize.
How to Create a Pareto Chart in Excel
Creating a Pareto chart in Excel is a straightforward process that can greatly enhance your data analysis. Follow these steps to build your own Pareto Chart:
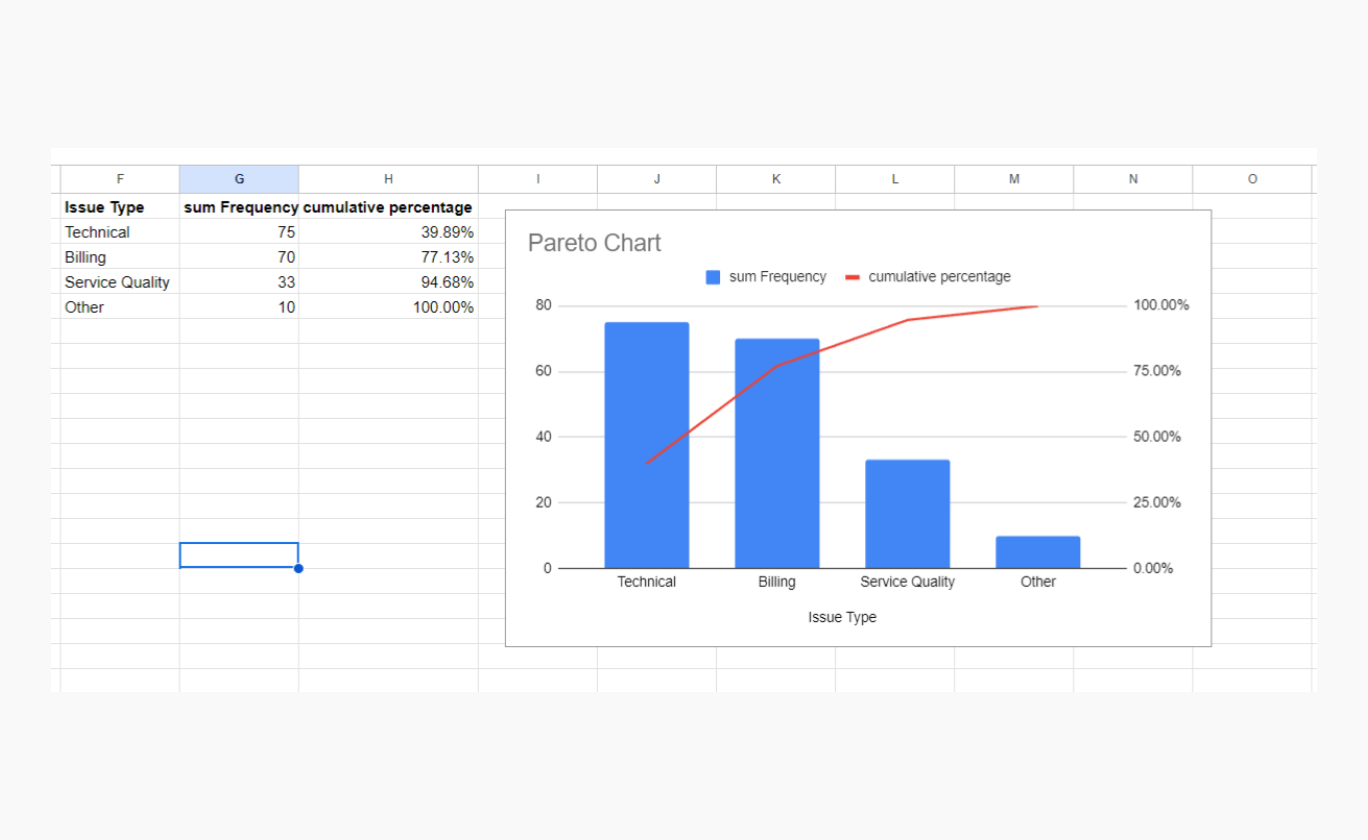
- Prepare Your Data. List the categories of your data in column A (e.g., types of customer inquiries). In the adjacent column B, list the frequency of each category.
- Group Repetitions and Sort Data. Use this query to make sure all repetitions are taken into account and sort your data in descending order: =QUERY(A1:B,"Select A, SUM(B) where B is not null group by A order by SUM(B) desc").
- Calculate Cumulative Percentages. In a new column, calculate the cumulative percentage for each category. This can be done by dividing the cumulative frequency of each category by the total frequency and multiplying by 100.
- Create the Pareto Chart. Select the data range, including the categories and their frequencies. Go to the "Insert" tab in Excel. Choose the "Histogram" option and select "Pareto."
- Customize Your Chart. Customize the chart by adding chart titles, axis labels, and adjusting the color scheme as needed.
Integration with Fishbone Diagram
The Pareto chart pairs well with the fishbone diagram. The fishbone diagram identifies the root causes of problems, which can then be analyzed using the Pareto chart to determine which causes are the most significant and warrant our attention.
Power of the Pareto Chart
The Pareto chart can be a powerful argument, especially in discussions with top management. When you need to convince someone of a particular point, the Pareto chart offers an excellent combination of visual clarity and factual evidence.
Conclusion
In conclusion, understanding and utilizing the Pareto chart can significantly enhance problem-solving efficiency and decision-making processes, making it an indispensable tool in various fields, especially quality management. With this guideline you understand the Pareto Chart principles and know how to create a Pareto Chart in Excel for your project.
About the Author
Violetta Chernobuk is a skilled content strategist and writer at Planyway, specializing in crafting insightful and engaging articles on productivity and project management. With her keen eye for detail and a deep understanding of user needs, Violetta ensures that every piece of content is both informative and inspiring, helping readers optimize their workflows and stay ahead in their projects.