37 Key Jira Reports to Explore Project Insights
10 min read
Jira provides excellent flexibility in terms of managing projects but what about accumulating project insights to analyze performance and make data driven decisions? Whether you're a project manager who needs to track sprint progress, a developer aiming to analyze bug trends, or a stakeholder requesting a high-level project overview — Jira project reports are your magical wand to make it all work.
In this guide we will walk you through the essentials of Jira reporting both built-in options and powerful third-party reporting plugins to elevate your project analysis.

What are Jira reports?
Reports in Jira is a wonderful tool to get a clear visual representation of the data captured within your Jira projects. This data, primarily spins around Jira issues and showcases a rich tapestry of information about your team's work, projects progress, and potential bottlenecks.
Why use Jira reports?
Jira reports transform raw issue data into digestible charts and graphs to empower you to make data-driven decisions, ensure the project stays on track and within budget, and, surely, demonstrate visualized data to the stakeholders.
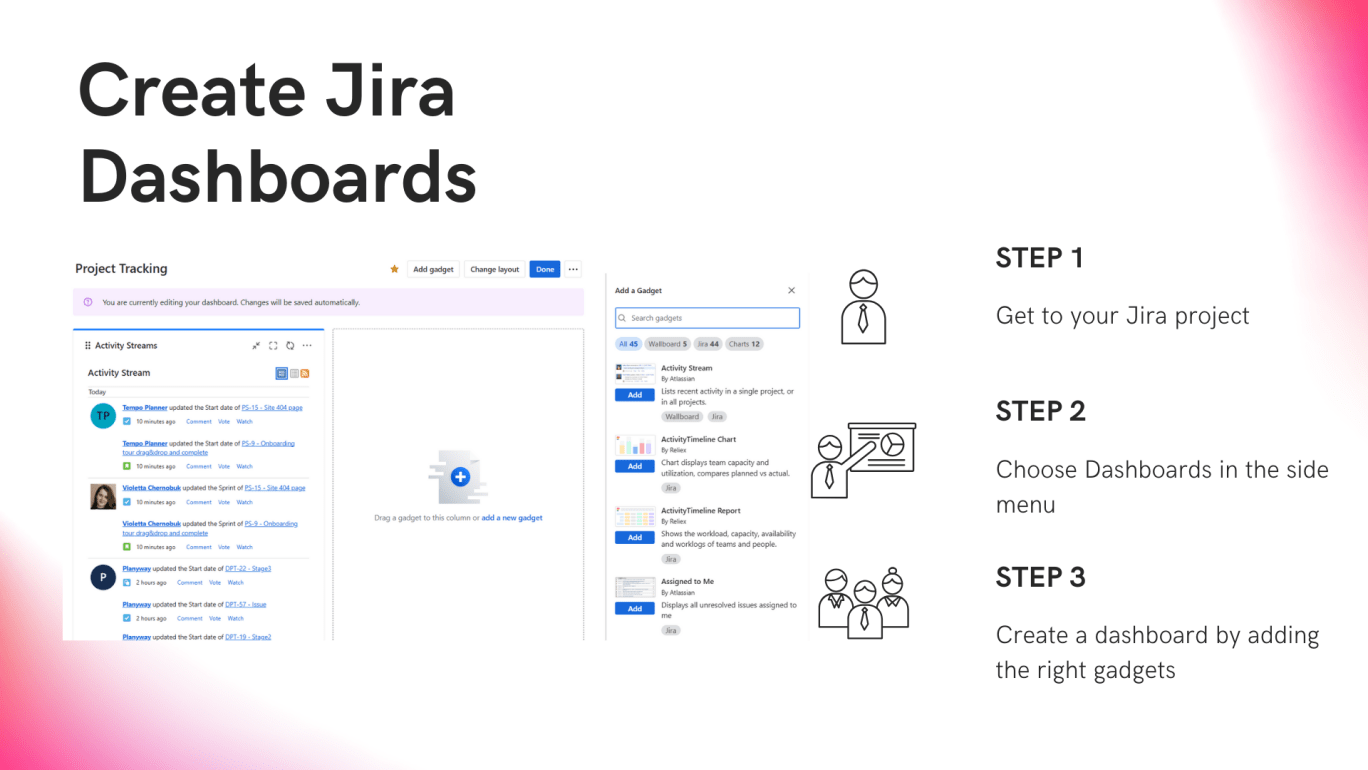
How to create reports in Jira
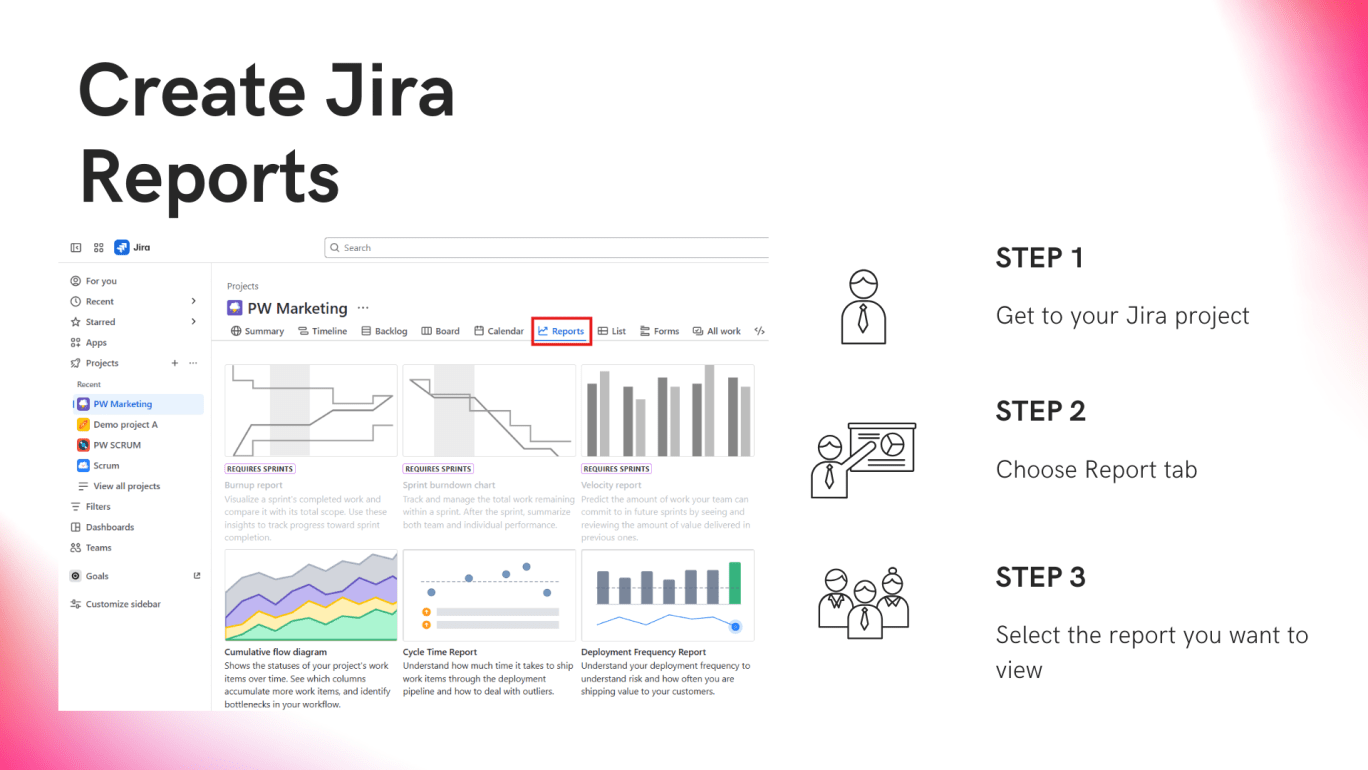
Let’s dive into how to make Jira reports:
- Step 1. Get to your Jira project
- Step 2. Choose Report tab (If you don’t have the correct permissions to access, contact your admin).
- Step 3. Select the report you want to view
 If the pre-made reports aren’t cutting it for your project’s unique needs, it’s time to get creative. You can create dashboards, make Jira custom reports with JQL, REST API, or explore third-party plugins. Below, you will explain all the details.
Default Agile reports in Jira
Let’s break down Jira reports available by default in team-managed projects that you definitely need to know about.
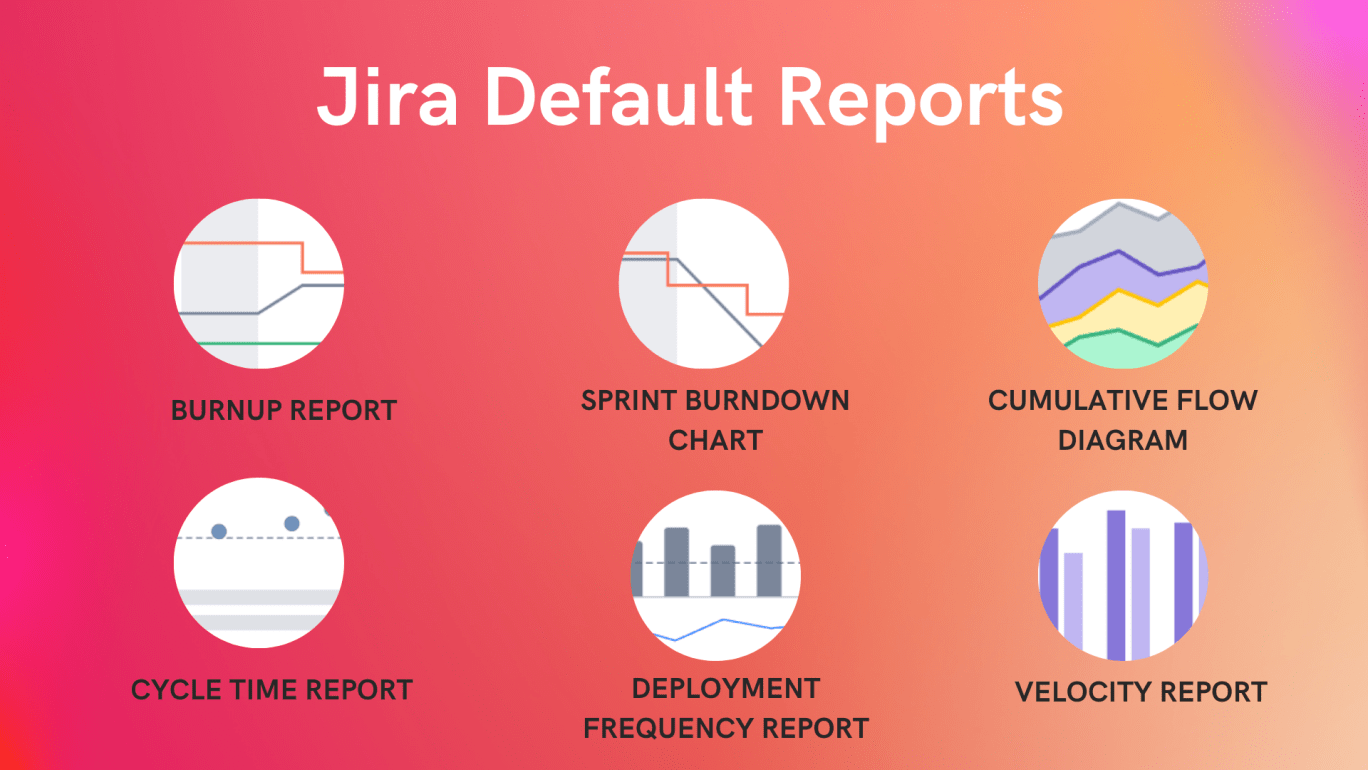
Burnup report
The burnup report is a true gem. You can easily see how much work your team has completed in a sprint compared to what was planned to gauge if you’re on track or need to intervene. It’s especially handy when you want to check if scope creep is happening.
Cumulative flow diagram
Ever wonder where your project is getting stuck? The cumulative flow diagram gives you a clear view of how long issues have been sitting in each of your statuses to spot bottlenecks quickly.
Velocity report
Velocity reports are an ideal tool to predict how much work your team can handle in the next sprint. It shows how much work your team has completed over a period of time, and this sprint report is great for planning future sprints.
Sprint burndown chart
This is your go-to tool to see how much work has been completed in a sprint versus what’s left to do. It’s perfect for preventing scope creep and keeping the team focused.
Cycle time report
This report tracks the time it takes for an issue to move from "In Progress" to "Done," helping you see how efficiently your team is working and adjusting your estimates.
Deployment frequency report
It shows how often you’re deploying code to help you track your team's release rhythm.
Jira reports and dashboards
Besides classic Jira reports, Jira has an option to create highly custom Jira dashboard, allowing you to add various gadgets that display key Jira metrics reports. You can configure these gadgets to show data relevant to your team or project.
Here’s the list of the coolest gadgets available in Jira by default:
- Assigned to me: lists all unresolved issues that are assigned to you. Super helpful for keeping track of your workload without having to search through endless boards or lists.
- Average age chart: shows the average number of days that issues have been pending which is great to identify tasks that need attention before they become bottlenecks.
- Activity Stream: helps you to stay up to date on what’s happening in real-time showing recent activity across projects.
- Wallboard: perfect for sharing in team meetings, as it displays live data like sprint progress or upcoming deadlines. And yes, it’s totally Wallboard capable, so you can have a dynamic, real-time view of your project’s health.
- Created vs. resolved chart: helps you track how many issues have been created versus how many have been resolved over a given period.
- Sprint burndown gadget: shows how much work is remaining in a sprint and can help you adjust priorities to hit your sprint goals.
- Time to first response: helps you monitor how quickly your team responds to issues.
- Workload pie chart: a handy way to visually see how work is distributed across your team.
Jira custom reports with JQL filters
Need more flexibility? There are three other scenarios that may help you custom reports in Jira. And the first to demonstrate is Jira Query Language (JQL).
JQL is a powerful instrument to filter and retrieve specific data from Jira. This approach opens up possibilities for creating highly custom Jira reports tailored to your exact needs. You can use JQL directly within Jira's issue search.
Here are a few practical examples:
Report #1: issues resolved last month
This JQL query visualizes all issues that are in a "Done" status and were resolved on or after the beginning of the previous month:
statusCategory = Done AND resolutiondate >= startOfMonth(-1M)
Report #2: high-priority bugs assigned to a specific team member
This query finds all the highest priority bugs assigned to Anna Johns within a specific project.
project = "Your Project Key" AND issuetype = Bug AND priority = Highest AND assignee = "Anna Johns"
Best third-party apps for Jira agile reports
Another workaround to get create custom reports in Jira is Atlassian marketplace that suggests a wide range of excellent third-party apps. These tools often provide more granular control over data and provide richer visualization options. Let's take a look at some popular choices:
Planyway for Jira
Planyway offers an intuitive visual way to plan, track, and report on work across multiple projects and teams. While known for its planning features, Planyway also offers robust time tracking and reporting functionalities.
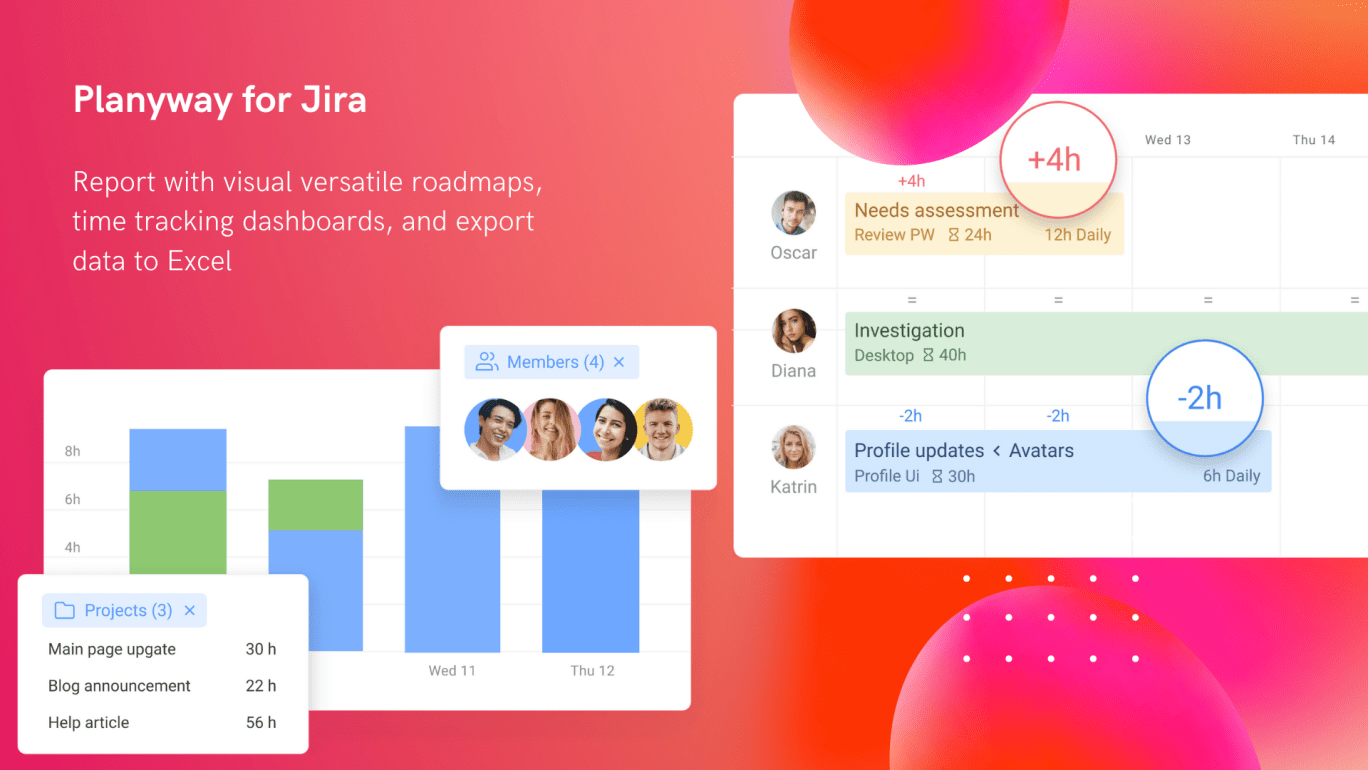
Visual reporting with timeline
Visualize project progress on the timeline at any angle (by team members, projects, epics) to see who is doing what at any moment and how you’re progressing towards deadlines, spot issues statuses, project health and potential overlaps.
Excel reports
Easily export all the data you have across projects in Excel or CSV to process data further and share.
Jira time tracking reports
Planyway also provides time tracking capabilities and accumulates data into powerful time reports. You can view data by issues, team members, and projects.
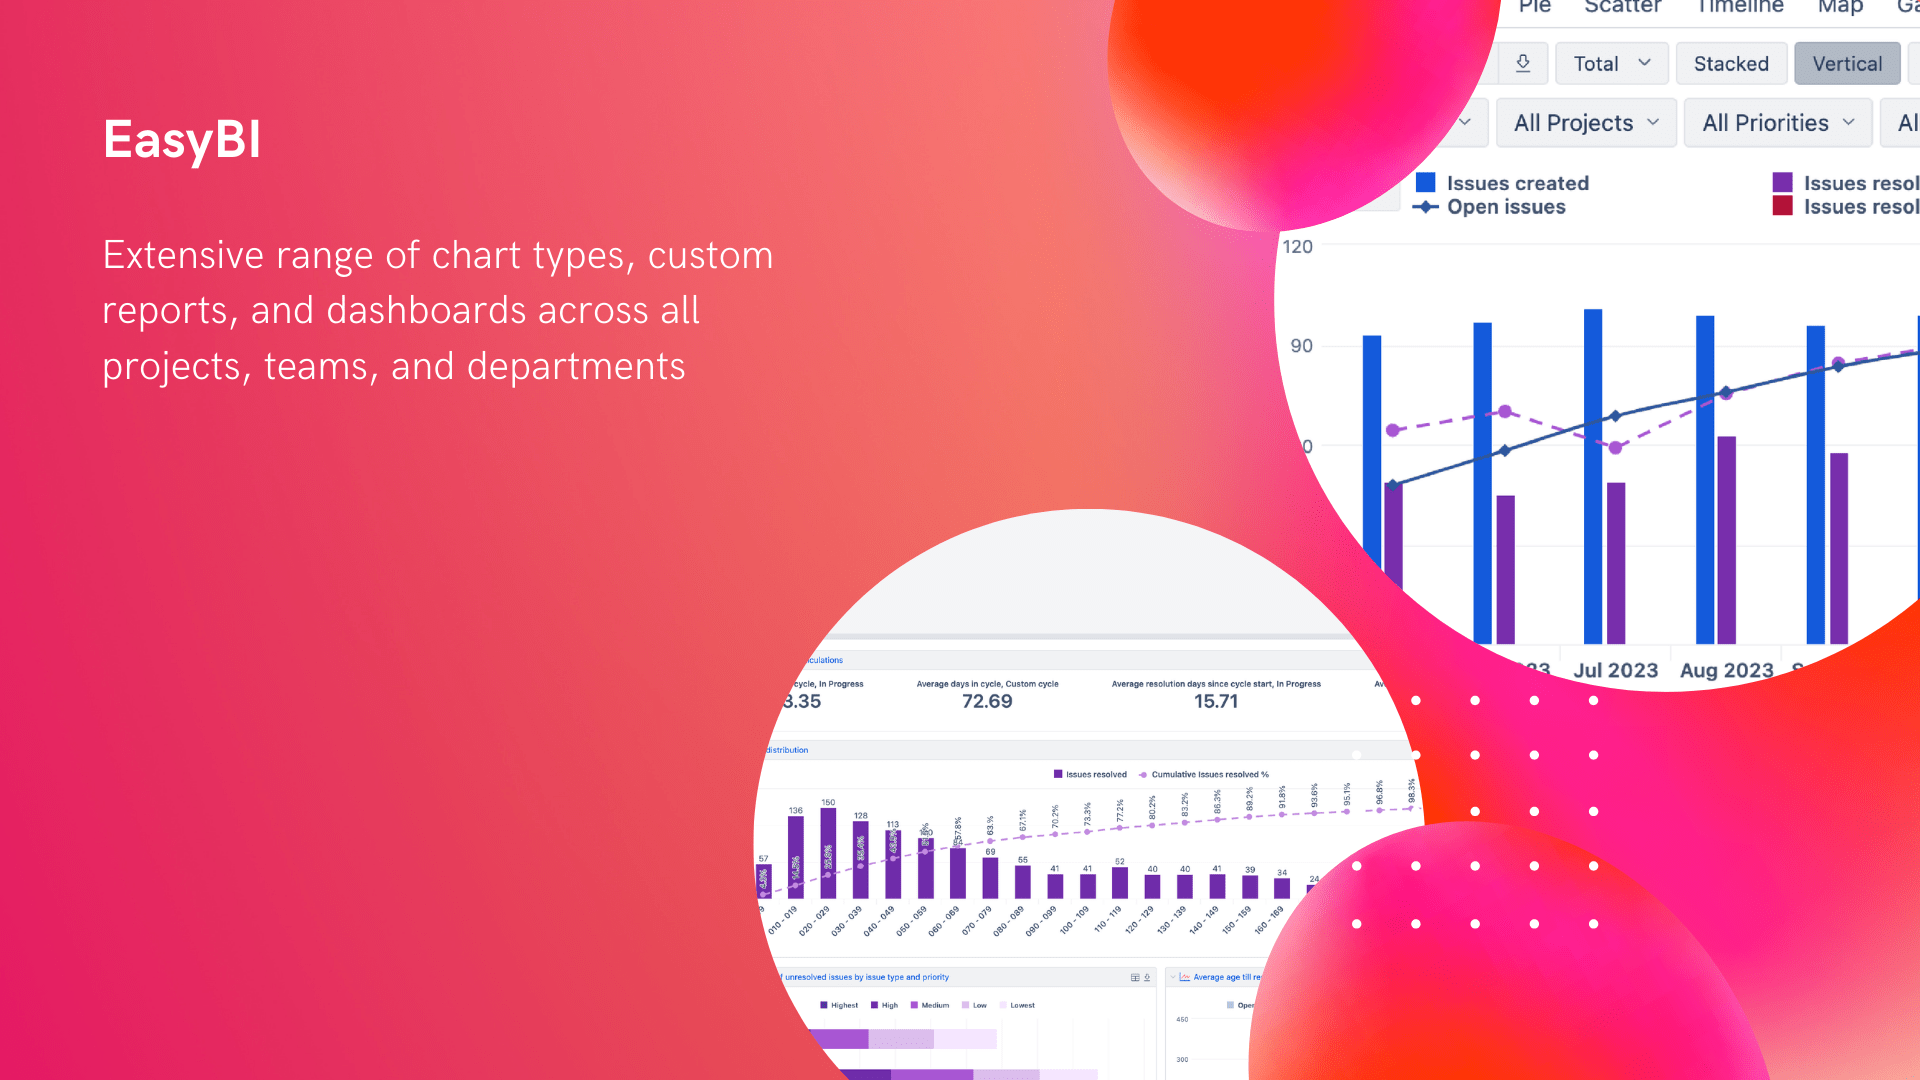
eazyBI reports and charts for Jira
eazyBI is a highly customizable reporting app for Jira. The plugin offers an extensive range of chart types, custom reports, and dashboards across all projects, teams, and departments. You can analyze Jira standard and custom fields, current and historical data, plus some of the popular marketplace apps.
The app provides standard calculations lie averages, linear trends, cumulative sums, time comparisons, etc. and custom calculations with MDX formula editor.
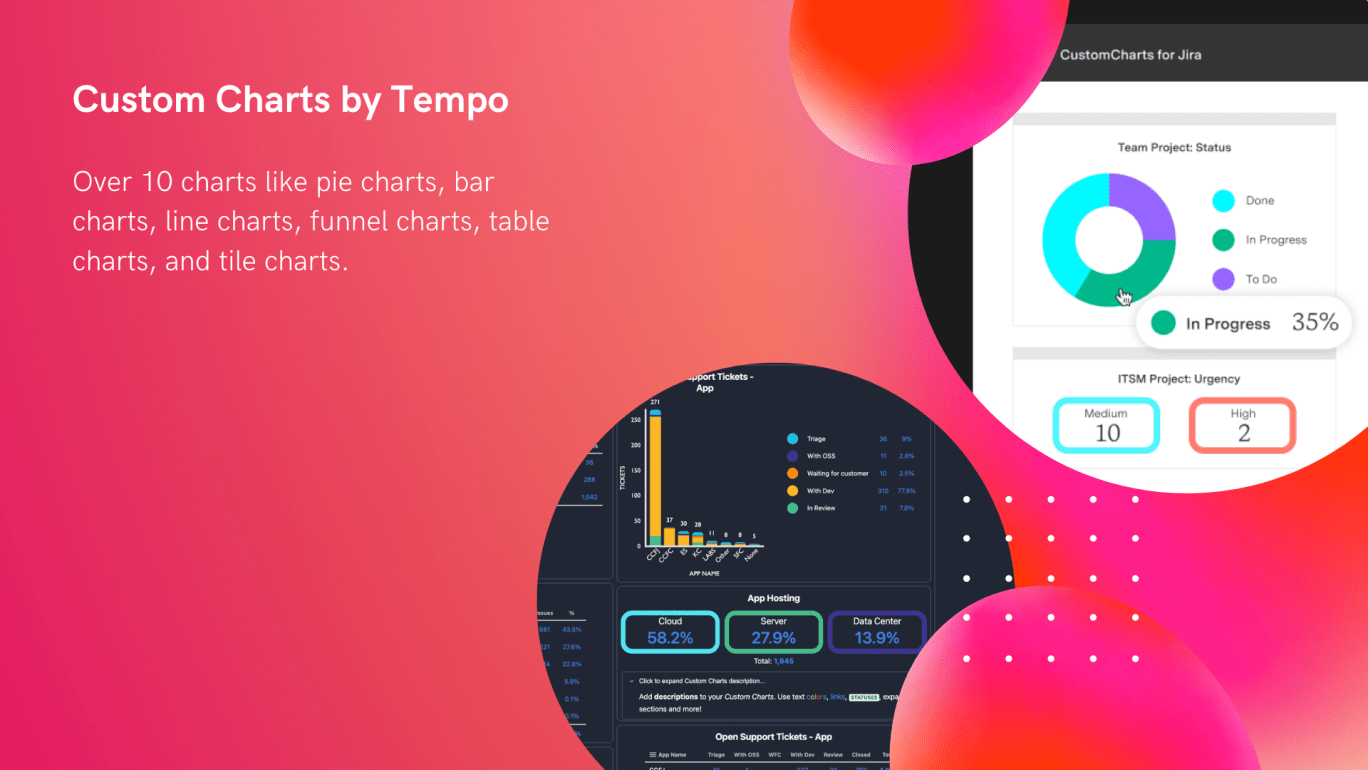
Custom сharts for Jira by Tempo
Custom Charts by Tempo focuses on streamlining Jira dashboards with visually appealing and informative charts and graphs. The app includes over 10 charts like pie charts, bar charts, line charts, funnel charts, table charts, and tile charts. You can start from scratch or try pre-made chart templates. What's mor ethe app is synced with other Tempo products.
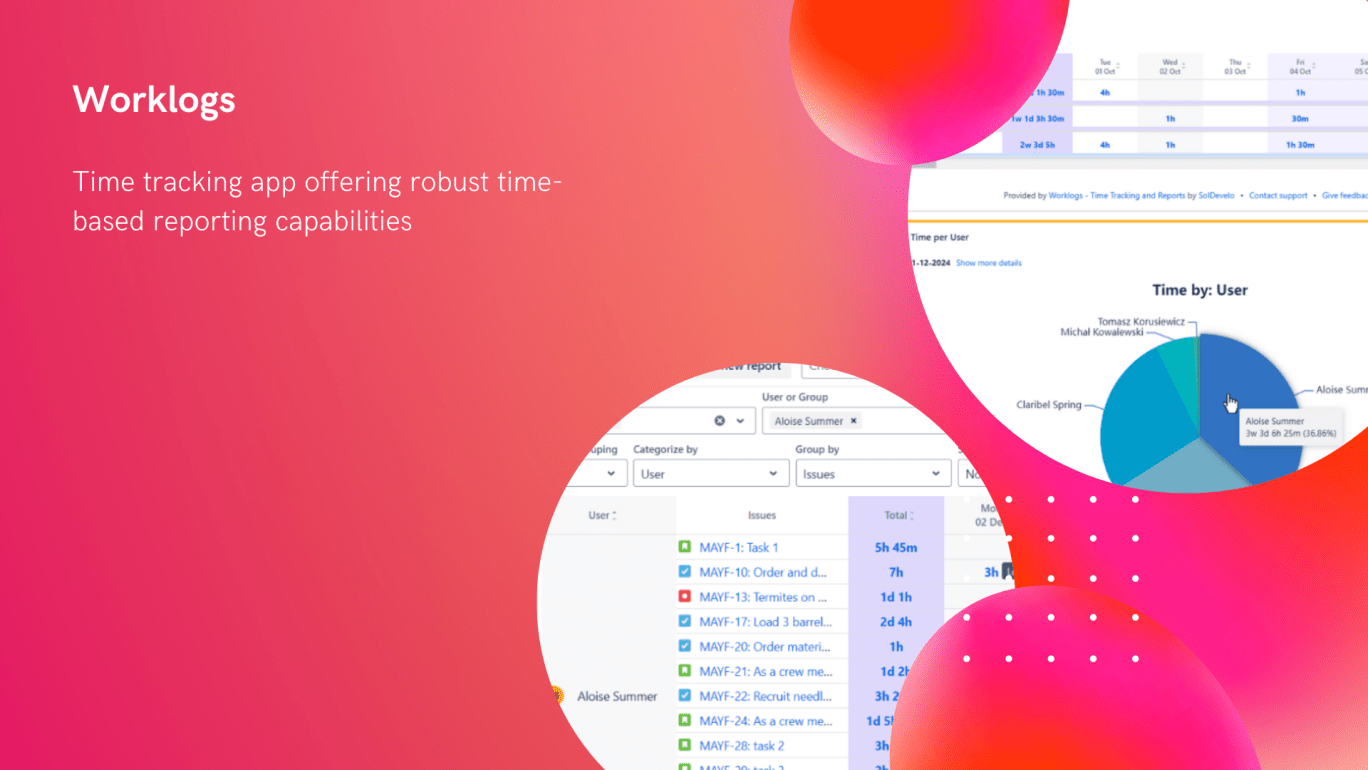
Worklogs
Worklogs is primarily a time tracking app offering robust time-based reporting capabilities. It allows teams to track time spent on Jira issues and generate detailed reports on team effort and time allocation. The time data can be then exported into Excel files.
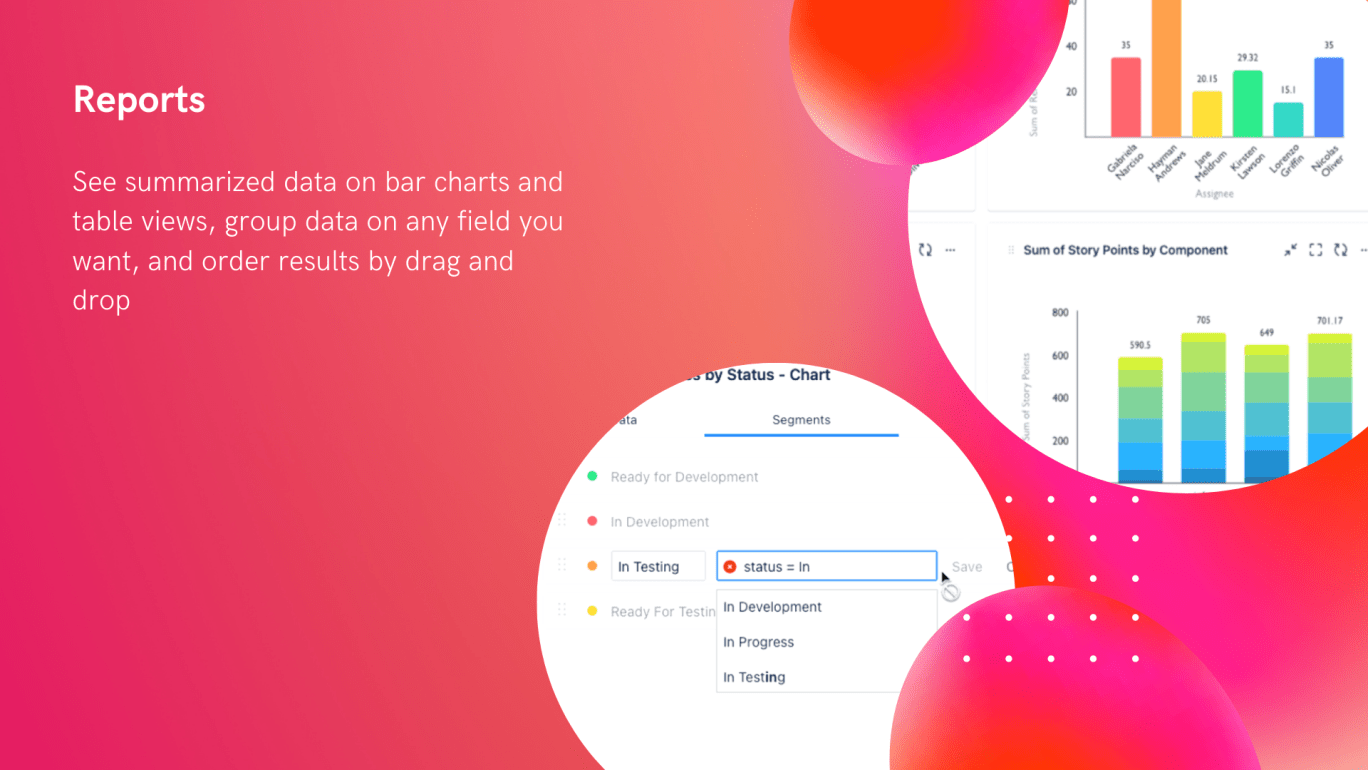
Reports - charts and graphs for Jira Dashboard
The app improves Jira dashboards with a variety of visually appealing charts and graphs. It aims to provide a simple and user-friendly way to visualize key project metrics. You can see summarized data on bar charts and table views, group data on any field you want, and order results by drag and drop.
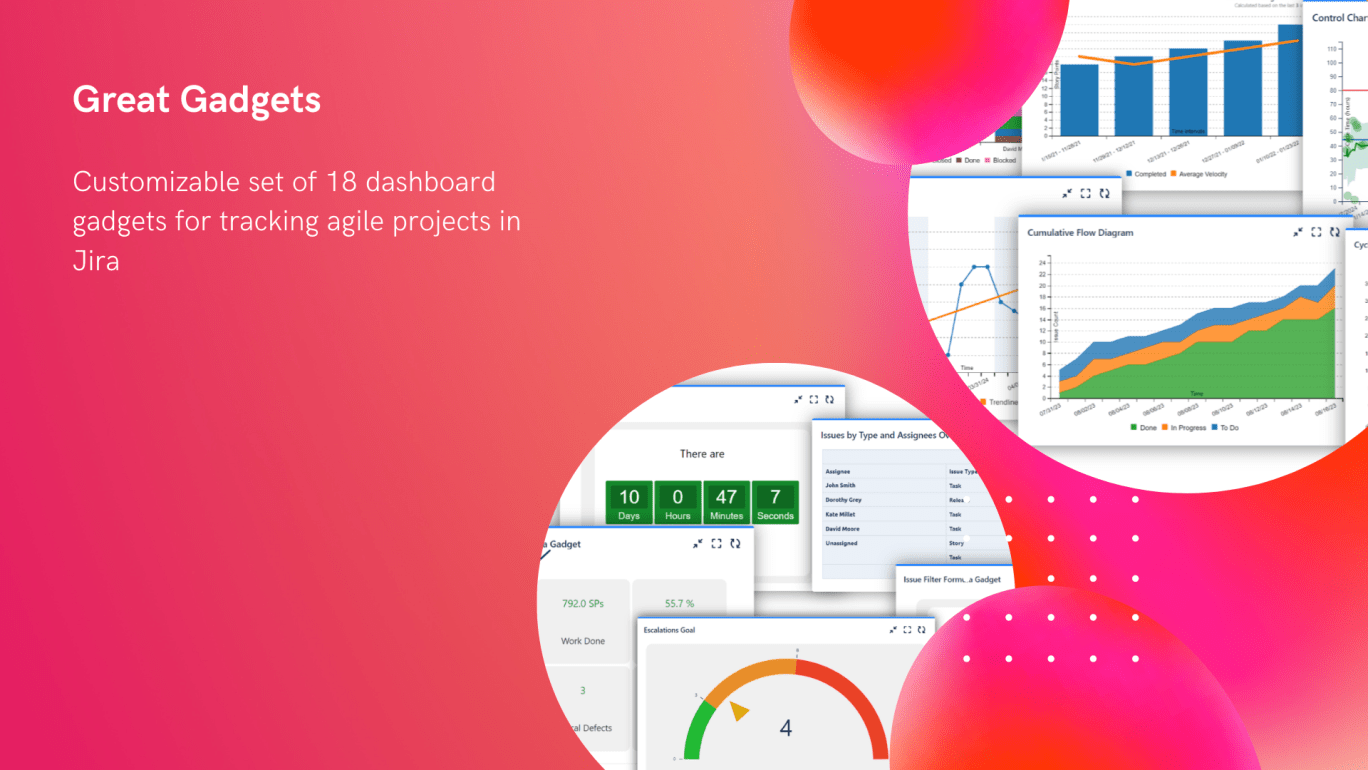
Great gadgets for Jira Cloud
The app offers a collection of highly customizable set of 18 dashboard gadgets for tracking agile projects in Jira. It's ideal for creating Jira sprint reports as well as Jira Kanban reports.
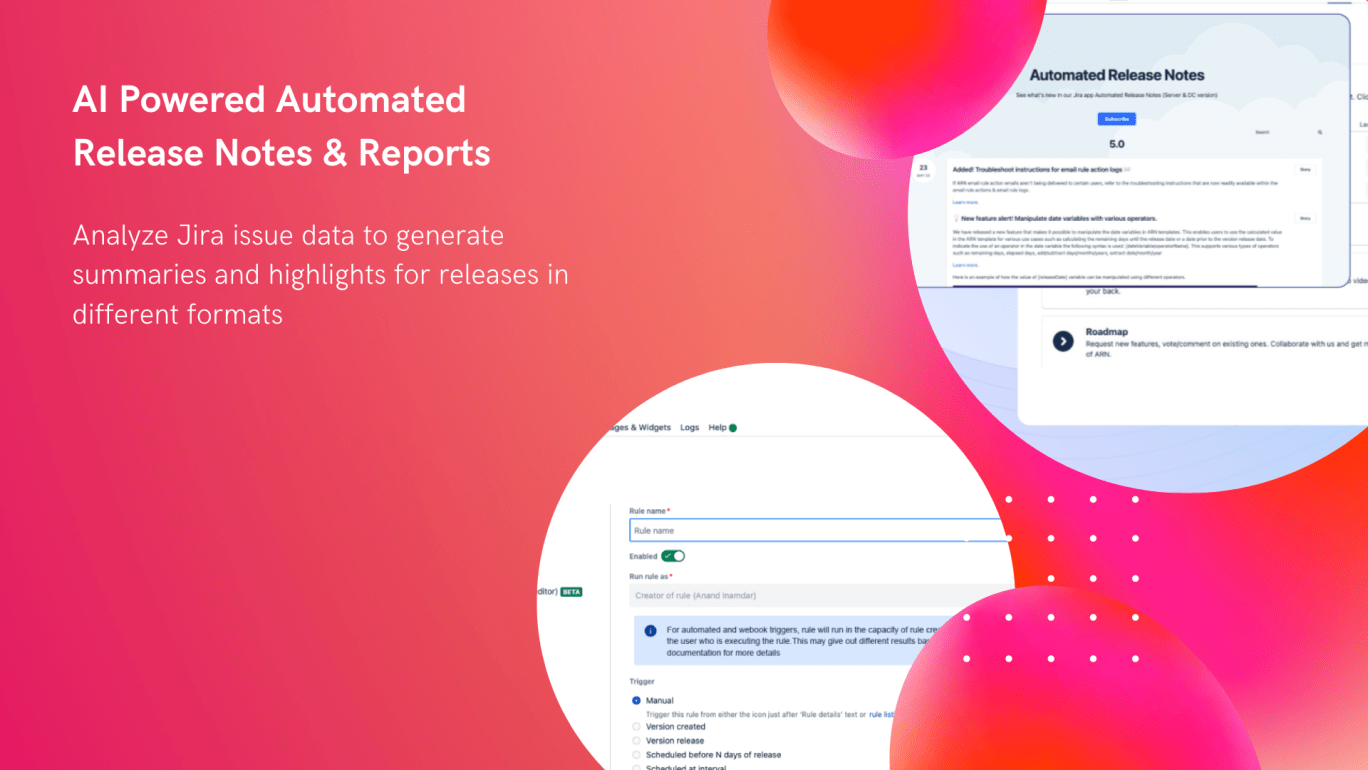
AI powered automated release notes & reports for Jira
This app takes a different approach by leveraging AI to automate the creation of release notes and reports. It can analyze Jira issue data to generate summaries and highlights for releases in different formats: email, PDF, Confluence, Slack, markdown, JSON, HTML. There are also multiple triggers to initiate reports and a long list of template to get started easily.
Tips for effective use of Jira reports
Whatever reporting tool you finally choose, it's important to follow these key rules to keep your reports useful:
- Define goals: list the questions you need to answer with these reports.
- Choose the right report type: based on your question list choose the right report types and customizations. Don't overload yourself with unnecessary data.
- Regularly review and analyze data: schedule regular reviews to identify trends, potential issues, and areas for improvement. Making reporting a part of your routine is the best way to keep things on track.
- Communicate insights: present your findings in a visual way to your team and stakeholders to share key information.
REST API to get create custom reports in Jira
Another option to customize your reports in Jira is REST API. It may seem quite sophisticated first due to a little coding magic, but once set up, you can grab Jira reports without even opening Jira’s web interface. Here is what you need to do:
- Step 1. Understand the basics
The REST API allows you to interact with Jira’s data programmatically. You’ll be making HTTP requests to pull specific data.
- Step 2: Make an API call
To get reports via the REST API, you’ll need to make a GET request to Jira’s endpoints. For example, if you want to pull information about a specific project, the call might look like this:
GET https://your-jira-instance.atlassian.net/rest/api/2/search?jql=project="YourProject" AND status="Done"
You can use JQL to filter the data just like you would with a regular Jira search. You can even get fancy and filter by assignee, sprint, or issue type.
- Step 3: Get your data
Once you send the API request, Jira will respond with JSON-format data. You’ll see all the details, like issue status, dates, and who’s working on what. Further, you can parse this data into a tailored report.
- Step 4: Automate and integrate
Set up scripts to automatically pull reports at certain intervals.
Conclusion
Jira reports, whether native or enhanced by third-party apps like Planyway for Jira, are crucial for gaining valuable insights into your projects and team performance. By understanding the different types of reports available, leveraging the power of JQL, and strategically utilizing customization options, you can make data-driven decisions, improve efficiency, and ultimately achieve greater project success. Explore the options, experiment with different reports and tools, and gain the most out of your Jira data.