What is a Gantt Chart? Definition, Benefits, Examples & Templates
10 min read
We establish the key parameters such as the project scope, deadlines, and possibly some high-level milestones in the project charter. However, the charter itself does not provide a detailed breakdown of timelines. In this article, we will explore how to effectively estimate project timelines using a Gantt Chart and how to proactively manage the project schedule to ensure timely delivery.
What Is a Gantt Chart?
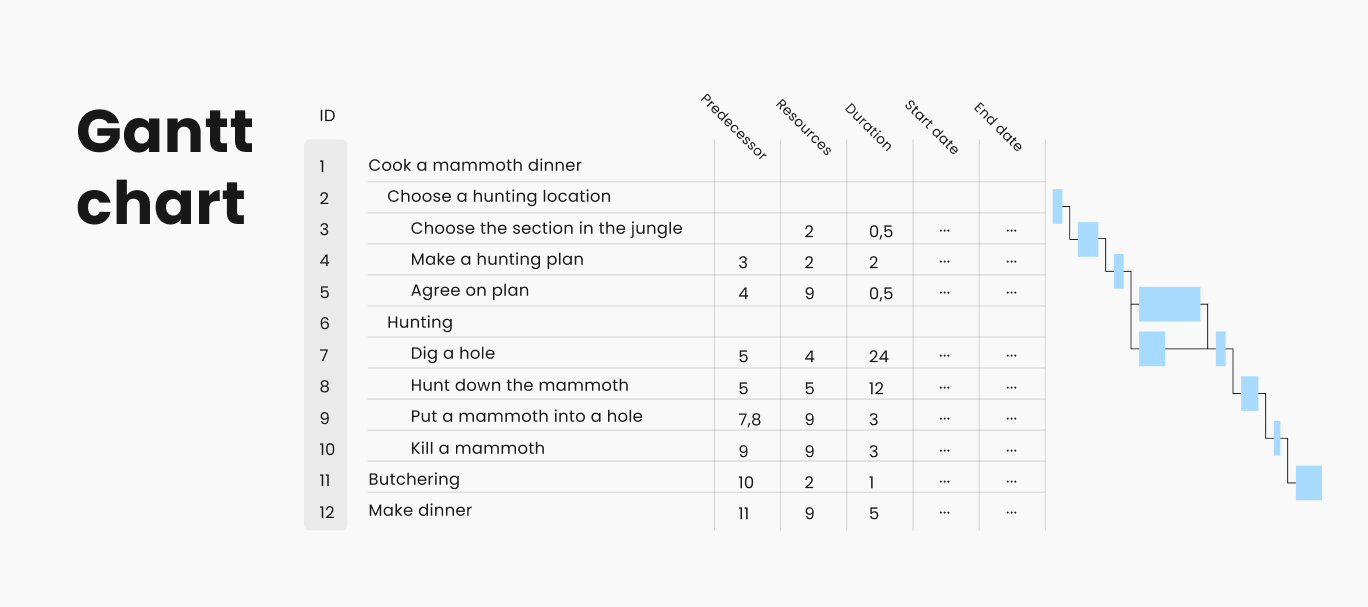
A Gantt chart tool is a powerful project management tool represented by the Work Breakdown Structure (WBS) and various estimates: duration, resources, dates on the left, and the network diagram on the right.
This combination is very convenient because you can see the work plan both textually and visually. It is very illustrative as it shows what has been done and what remains to be done.
A typical Gantt chart displays the following four items:
- Tasks: specific activities or work items within the project.
- Timeline: the project’s timeframe, usually displayed across the top or bottom of the chart.
- Bars: horizontal bars representing the duration of each task.
- Dependencies: relationships between tasks, indicating which tasks must be completed before others can begin.
What Is the Purpose of Gantt Chart?
The primary purpose of a Gantt chart is to:
- Visualize Project Schedule: provide a clear picture of the Gantt chart timeline and task durations.
- Track Progress: monitor the status of tasks and the overall project.
- Manage Resources: allocate resources efficiently and adjust workloads as needed.
- Identify Dependencies: highlight relationships between tasks to prevent delays.
How To Make A Gantt Chart and A Project Schedule
1. Do Gantt Chart groundwork
Once we have an initial draft of the project scope, we’re ready to start detailed timeline planning. Until we understand what needs to be done, we cannot know how long it will take. By now, we should have artefacts like the stakeholder registry and the project charter, and we have completed the three steps of scope definition: requirements, concept, and Work Breakdown Structure (WBS). Now, we move on to working with timelines through the Gantt chart.
2. Build a network diagram
The first step in schedule planning is creating the sequence of activities. The WBS gives us an idea of what tasks need to be completed to achieve the result, but the order of these tasks is not yet defined.
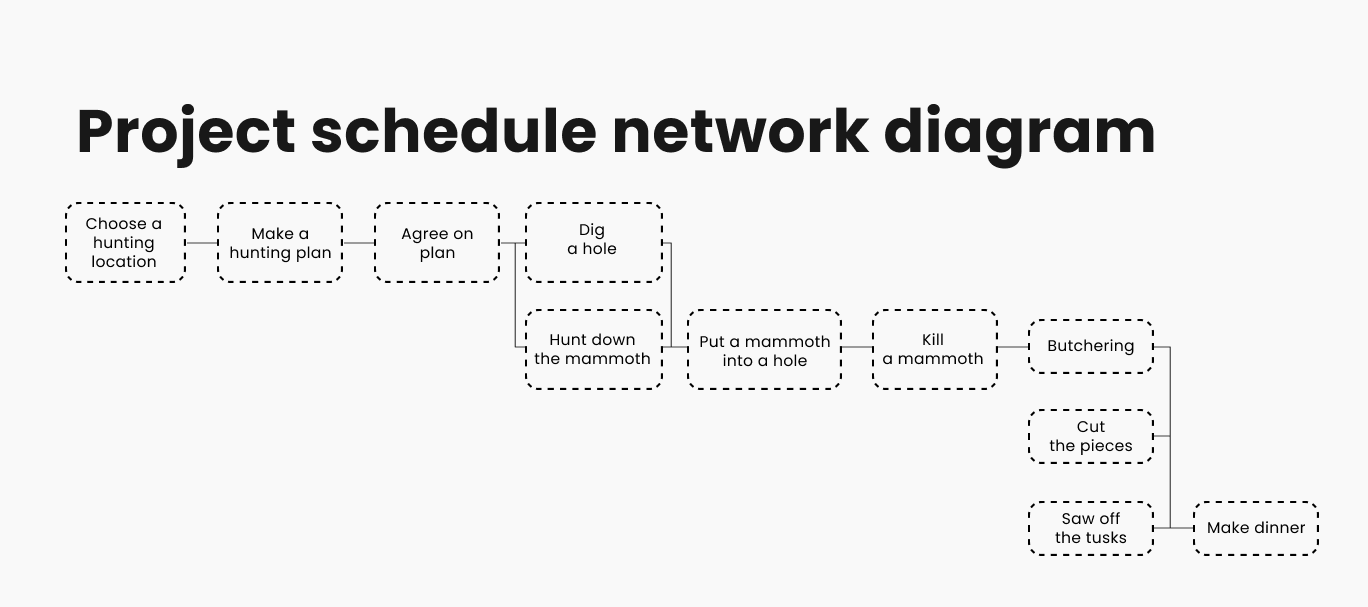
To create the sequence you will need to turn your WBS into a chain of activities or a network diagram. A network diagram is where we take the lowest level of the WBS, stretch the tasks represented by rectangles into a sequence, and connect them with arrows indicating dependencies.
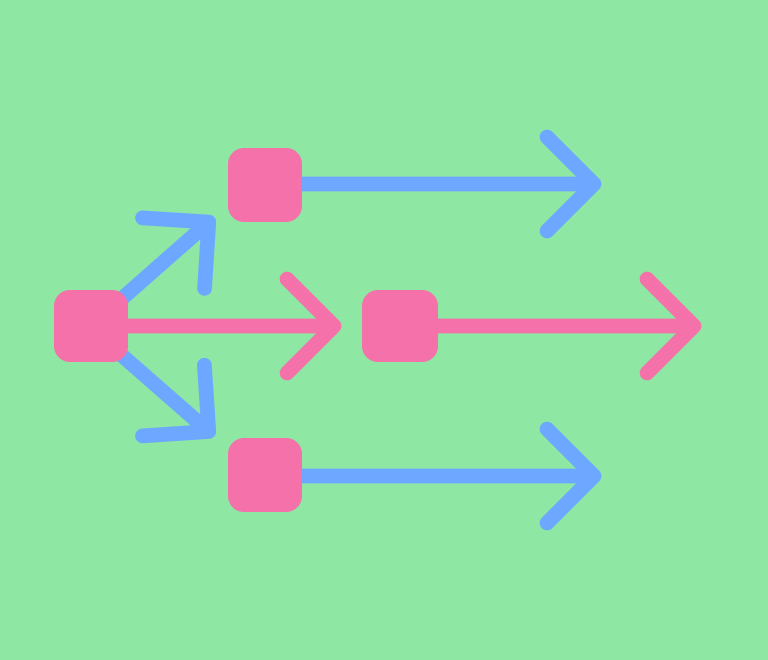
There are different types of dependencies, but typically, in 99% of cases, the Finish-to-Start (FS) dependency is used. This means that when the predecessor activity finishes, the successor activity can start. If a task has two predecessors, both must be completed before moving on to the next task.
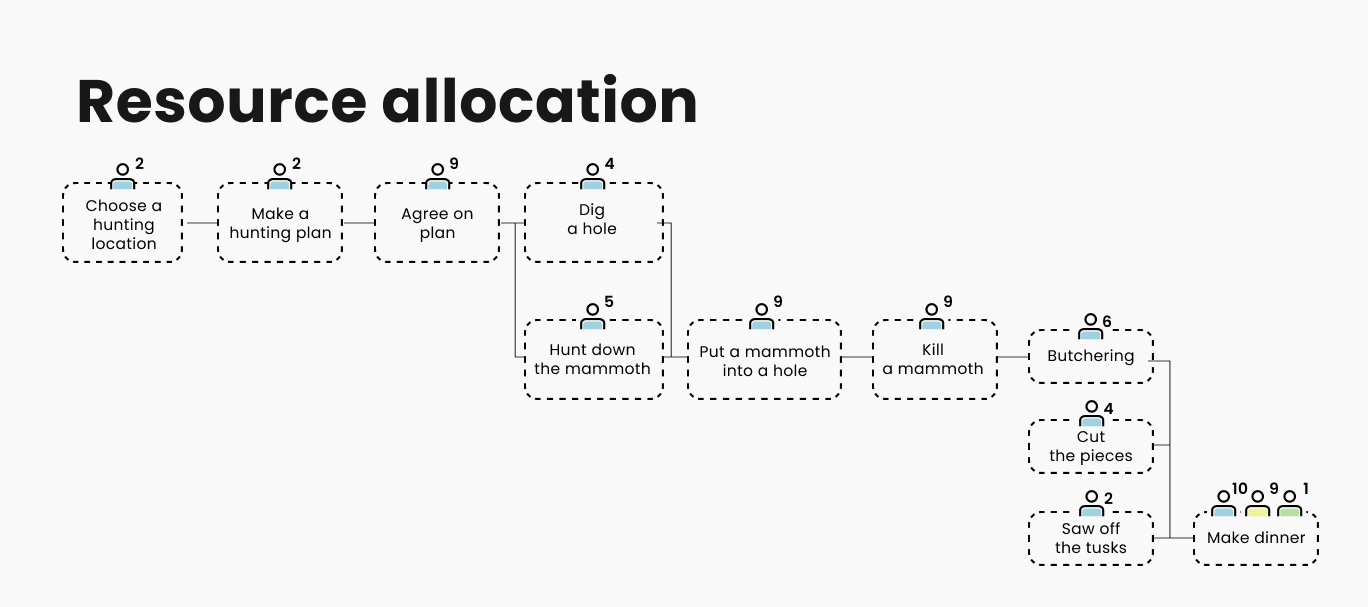
3. Allocate resources
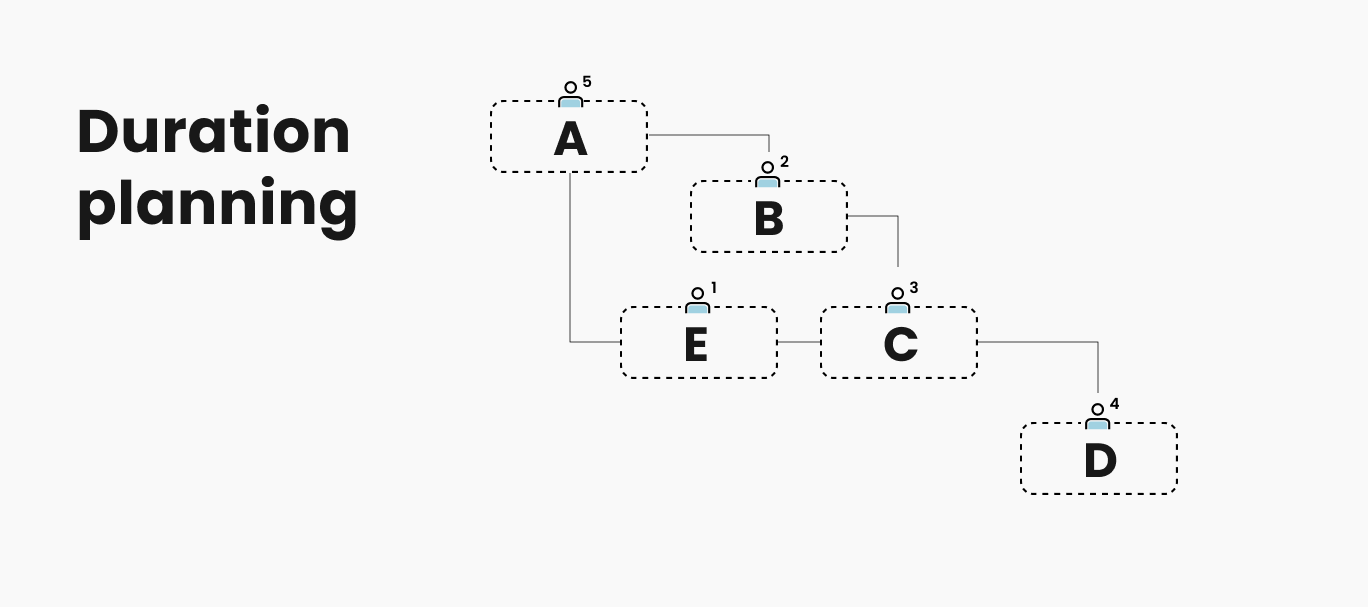
The second step is to identify resources, understanding who will perform the tasks and what tools they will use. In the network diagram, we specify resources as precisely as possible, unlike in the project charter. If we know the names of people, we write them down as the duration of tasks can significantly depend on who is working on the project. The more specific you are, the easier it will be to estimate timelines accurately.
4. Estimate task durations
The third step is to estimate the duration of tasks. This is extremely challenging, and there are no foolproof methods for these estimates. There is only a set of techniques that attempt to help, with expert judgment being fundamental. If you’d like to learn how they work, we have a very detailed article on estimation techniques.
5. Identify a critical path
There are two definitions of the critical path that do not contradict each other. The critical path is either the longest path in the network diagram or the shortest possible time to complete the project.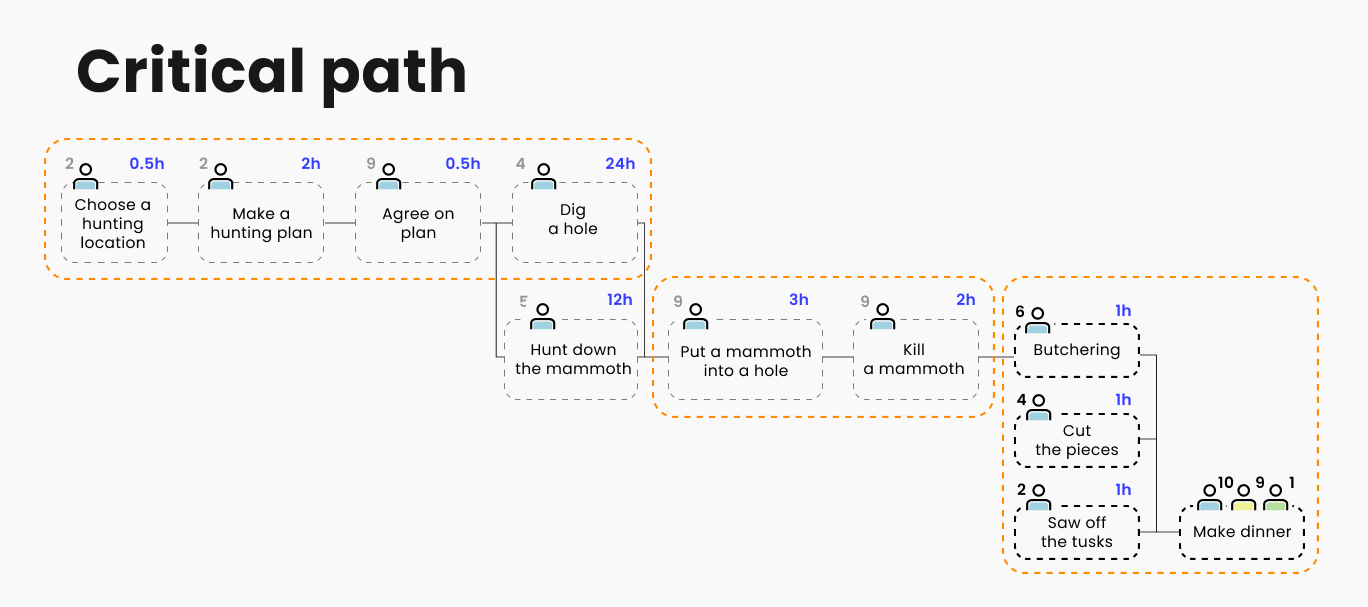
In order to determine a Gantt chart, go through all the tasks. If a task has no parallel tasks, it is automatically on the critical path. If there are parallel tasks, we either look at the longest one, or if the durations are the same, we can choose either.
The chain of such tasks determines the project duration. If we outline them, we get a path - the critical path. In a simple project, this is clear, but in reality, with lots of parallel tasks, finding the critical path by eye is difficult. It is better to use appropriate software. Gantt chart project management software usually highlights the critical path in color.
Why is critical path important? Tasks on the critical path require increased attention from the manager, careful planning, and control. Any delay in tasks on the critical path delays the entire project.
Can a project have multiple critical paths? Yes, if the critical path branches into tasks with equal duration, the project has two critical paths. Generally, the more critical paths a project has, the riskier it is.
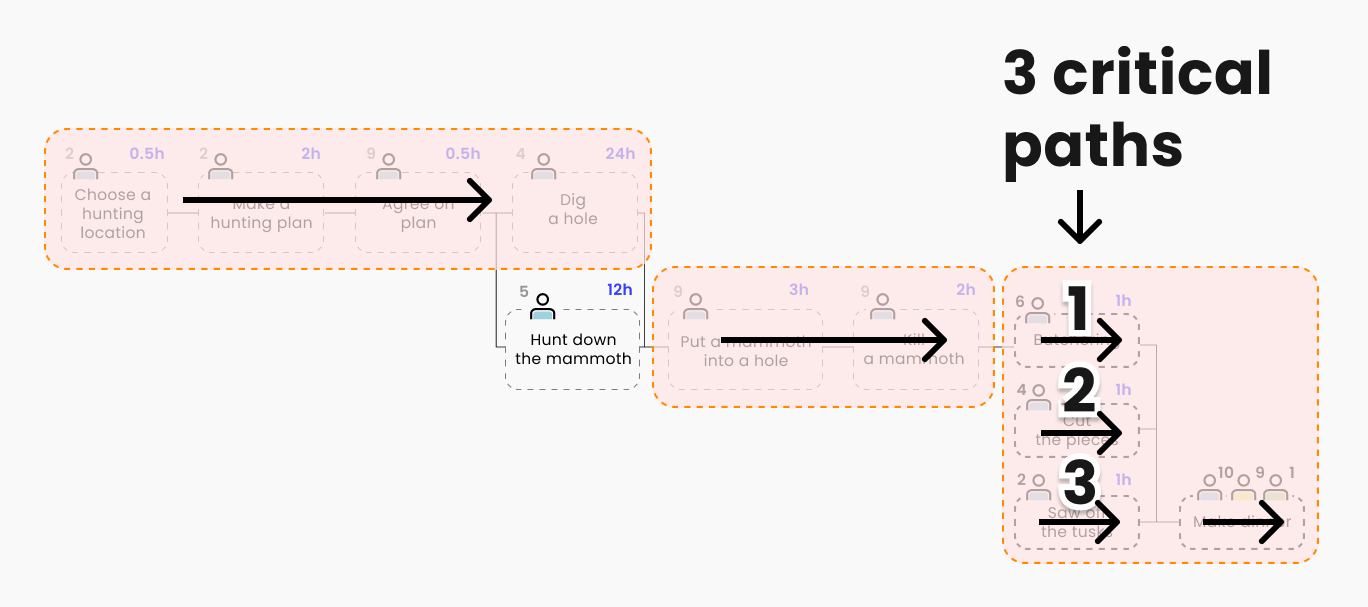
There is also the concept of a near-critical path. For instance, if the critical path is 120 days, and a parallel path is 118 days, the difference is minimal. This path is significant because, with slight fluctuations, it can become critical.
6. Define milestones
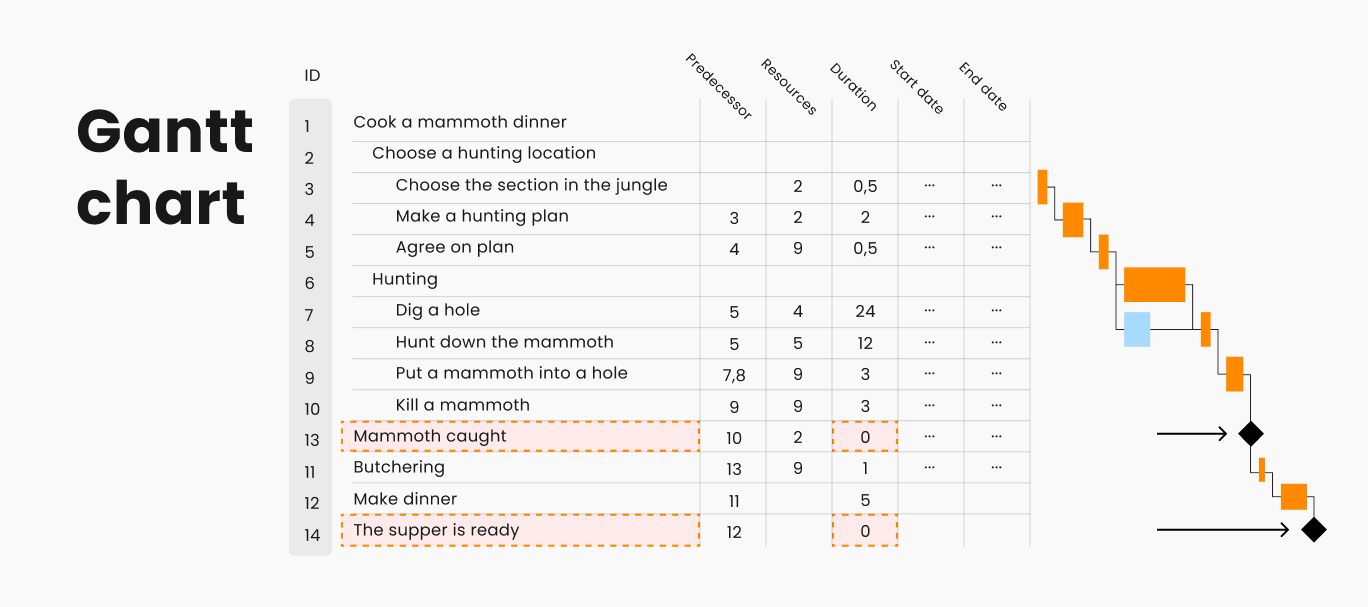
Milestones are tasks with so-called zero duration. They are important markers for you or the client and may be specified in the project charter. Milestones are a great way to communicate with clients and project sponsors, represented as diamonds on the chart.
There is also a Gantt chart variation called “milestone chart”. In this case, all tasks disappear, leaving only milestones, showing which have been achieved and which have not. This view is ideal for demonstrating progress to sponsors or clients.
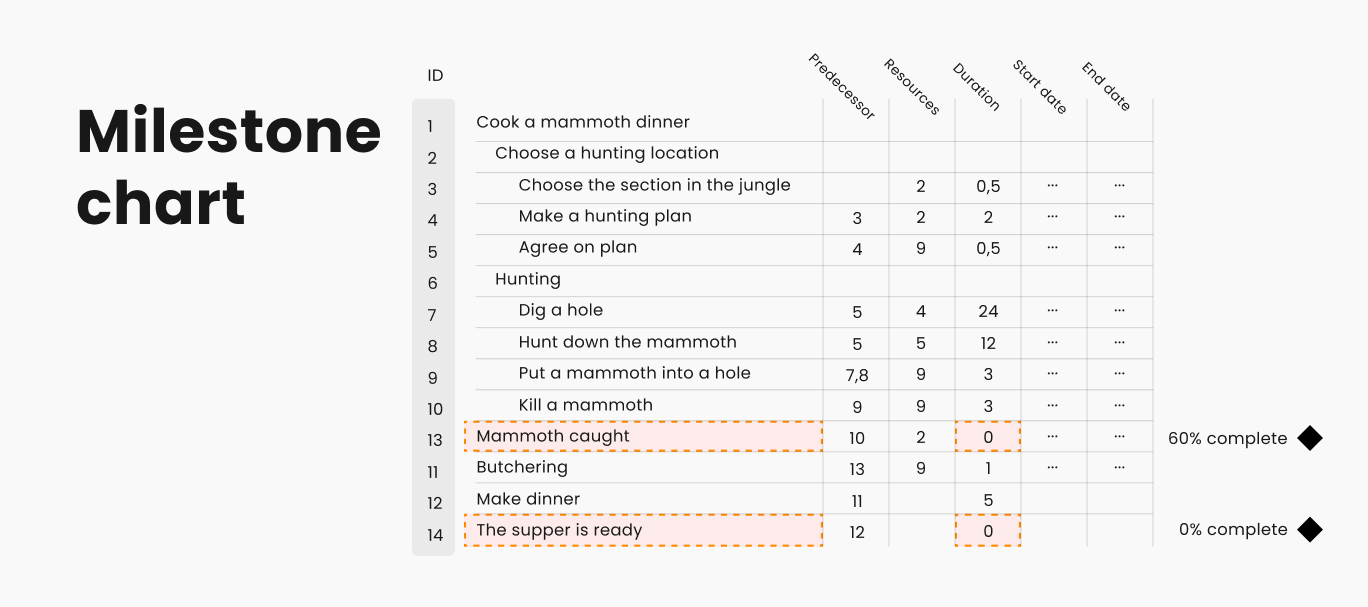
There is even an exaggerated approach to working with milestones. Here, the manager removes all tasks from the Gantt chart and does not try to plan their durations, instead creating various levels of milestones (sponsor milestones, manager milestones, team milestones), resulting in a schedule entirely made up of diamonds. This approach is seen as inconvenient, primarily for the manager and team, as it does not help them understand if they are on track.
7. Create a project schedule
Once we set up a Gantt chart, we came to the final step - creating the calendar. In project management, the term "schedule" has a very specific meaning. Once we have sequenced the tasks, decided who does what, and estimated the duration of tasks, it is still not a schedule.
For it to become a schedule, we need to take one crucial step – tie it to the calendar. By linking it to the calendar, we consider weekends, holidays, vacations, etc., thus aligning with real dates to understand actual timelines and obtain the project schedule baseline.
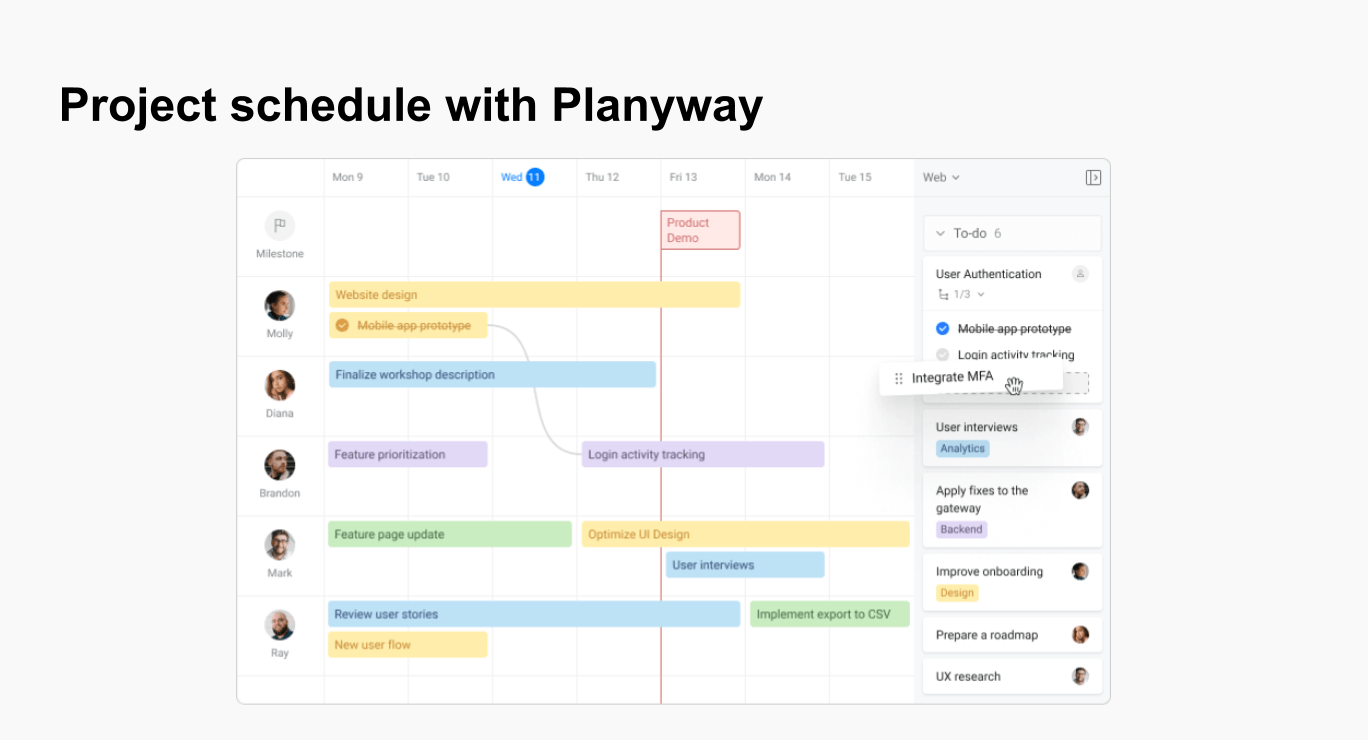
One of the easiest ways to manage your project schedule is Planyway. The app allows you to set up a project calendar, create and assign tasks, visualize project timelines, and utilize time tracking features.
How to Make a Gantt Chart in Excel
While there are numerous tools to make a Gantt chart, you can always stick to good old Excel (or Google Sheets) as it’s very straightforward and doesn't require any special software. Here is a Gantt chart example created in Excel.
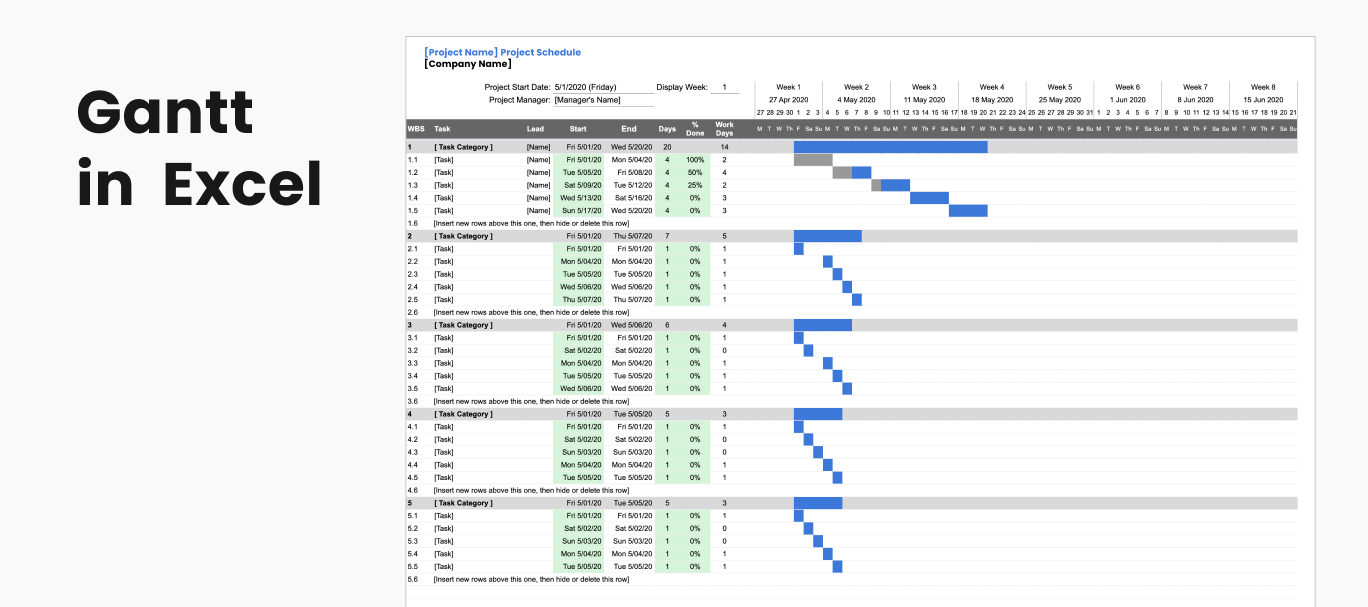
🗳️ Download Gantt Chart template for Excel for free
Step 1. Prepare Your Data
List all the tasks in your project. Determine the start date and duration for each task.
Step 2. Set Up Your Excel Sheet
Open Excel and enter your task data in a table format. Include columns for Task Name, Start Date, Duration, and End Date (which can be calculated as Start Date + Duration).
Step 3. Insert a Bar Chart
Select your data range, then go to the Insert tab and choose a Stacked Bar Chart.
Step 4. Format the Chart
Convert the chart to a Gantt chart by adjusting the task bars. Right-click on the chart, choose Select Data, and edit the Horizontal (Category) Axis Labels to match your Task Names.
Format the bars by setting the "Start Date" series to no fill and adjusting the "Duration" series to reflect the actual task durations.
Step 5. Show Dependencies in a Gantt Chart
In Excel, you can manually draw lines to create dependencies.
Step 6. Enhance the Chart
Customize the chart with different colors, labels, and gridlines to improve readability.
What Is the Main Limitation of a Gantt Chart When Using for Project Management?
We’ve talked a lot about the benefits of this instrument but is there any drawback? Despite their advantages, Gantt charts come with notable limitations that can hinder their effectiveness in certain scenarios.
- Scalability: one of the primary limitations of Gantt charts is their complexity when scaled up for large projects. As the number of tasks increases, the chart can become overwhelmingly cluttered. This clutter makes it difficult to discern individual tasks, dependencies, and milestones. For projects involving hundreds or thousands of tasks, the sheer volume of information can render the Gantt chart nearly unreadable, reducing its effectiveness as a management tool.
- Static Nature: Gantt charts are inherently static, which poses a significant drawback for dynamic projects where tasks and schedules are subject to frequent changes. Adjusting the chart to reflect these changes can be cumbersome and often leads to confusion. Additionally, the risk of human error in updating the chart can lead to inaccuracies that compromise the project's overall management.
What is a Gantt Chart Used For?
Gantt charts are widely used for both planning and tracking. While they serve related functions, their application for planning and tracking involves distinct approaches and focuses.
We’ve carefully run through the planning with a Gantt chart. In general, there are 4 main points to highlight:
Visualization
- Big Picture View: provides a comprehensive overview of the entire project, helping stakeholders understand the scope and sequence of activities.
- Milestones and Deadlines: clearly marks key milestones and deadlines, ensuring that critical dates are visible and accounted for.
Risk Management
- Identifying Bottlenecks: helps in identifying potential bottlenecks and critical paths, allowing for proactive measures to mitigate risks.
- Scenario Planning: facilitates the creation of alternative plans or scenarios, providing flexibility in case initial assumptions prove incorrect.
Communication
- Stakeholder Alignment: ensures that all stakeholders have a clear understanding of the project plan, facilitating better communication and alignment.
- Baseline Establishment: sets a baseline against which project progress and performance can be measured during the tracking phase.
But as well as using Gantt charts for project planning, it’s also a great instrument to do the tracking part:
Progress Monitoring
- Updating Status: during the tracking phase, Gantt charts are updated regularly to reflect the actual progress of tasks, showing which tasks are on track, delayed, or completed.
Performance Measurement:
- Variance Analysis: compares planned progress against actual progress, helping to identify variances and analyze their causes. Typically, there are two bars for each activity: a baseline bar to shows the original planned schedule and an actual bar to reflects the actual progress and current schedule of the task.
- Trend Identification: tracks trends in task completion, allowing project managers to predict potential future delays and take corrective action.
Resource Management:
- Resource Reallocation: facilitates the reallocation of resources based on current project needs and progress, ensuring optimal utilization.
- Load Balancing: helps in balancing the workload among team members, avoiding overloading or underutilizing resources.
Decision Making:
- Informed Decisions: provides the data needed to make informed decisions about changes to the project plan, resource allocation, or timelines.
Reporting:
- Status Reports: generates status reports that provide stakeholders with up-to-date information on project progress and any issues encountered.
- Transparency: ensures transparency in project execution, fostering trust and accountability among team members and stakeholders.
Conclusion
While the Gantt chart was invented decades ago, it's still one of the most useful approaches in planning out projects. Apart from planning and visualizing the project flow for tracking purposes, it’s also irreplaceable for scheduling. The Gantt chart for scheduling can help you make a project calendar with ease.