The Ultimate List of Best Trello Gantt Chart Tools in 2026
10 min read
Trello is a go-to tool for organizing projects, but it often lacks workflow insights for tracking progress. Gantt chart power-ups fill this gap by adding timelines, dependencies, and resource management.
This article explores why Gantt charts are essential for Trello and reviews the best power-ups to boost your Trello project management.
What Is a Gantt Chart and Why Do You Need It?
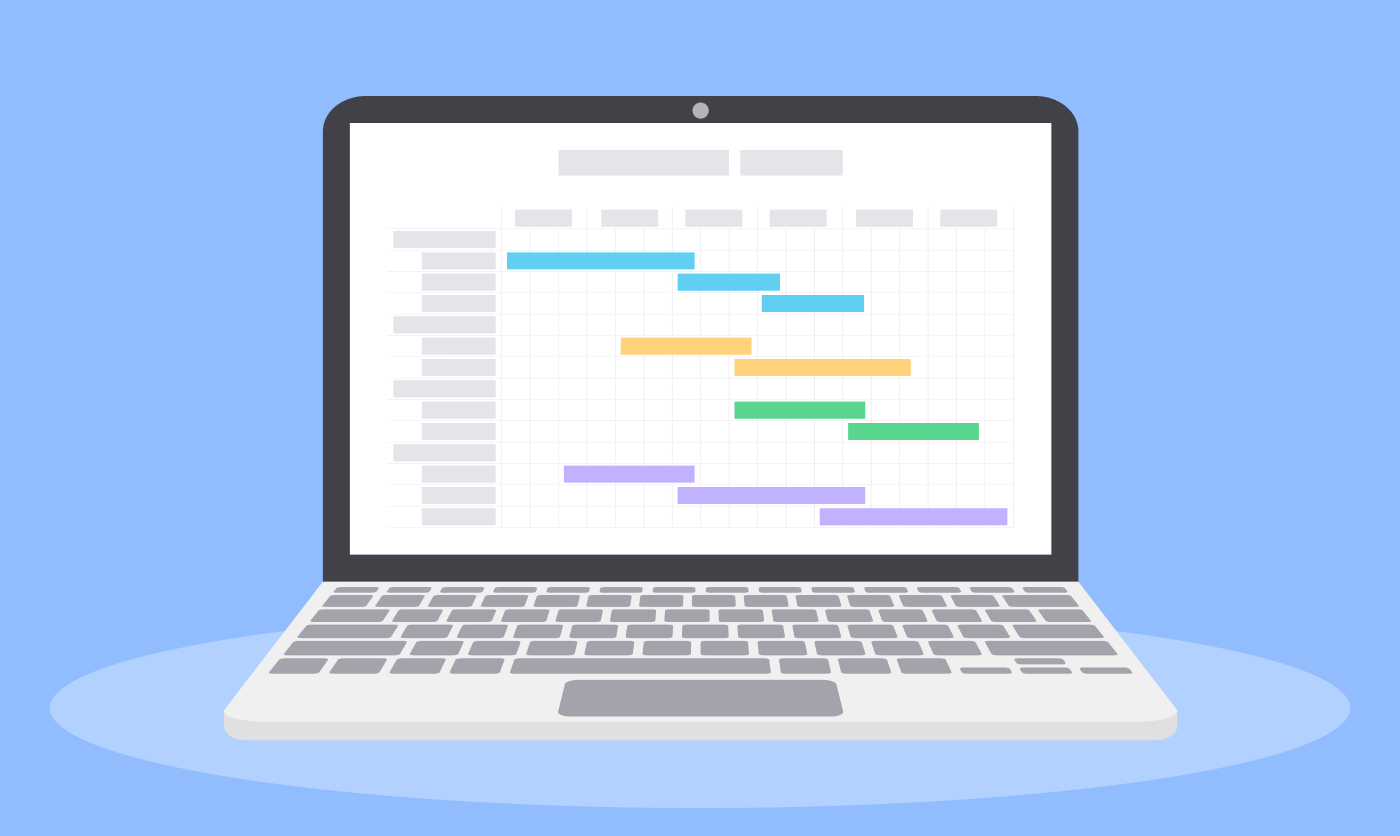
A Gantt chart is a visual tool designed to simplify the planning and execution of complex projects. Originating during the early 20th century, Gantt charts have stood the test of time due to their utility in managing workflows and resources efficiently (Source: PMI).
At its core, a Gantt chart provides a bar-chart-style visualization of a project schedule, showing the start and finish dates of tasks, their durations, and interdependencies. This makes Gantt charts invaluable for timeline planning, tracking milestones, and identifying bottlenecks that might hinder project progress.
A 2026 Project Management Institute study found that 72% of project managers use Gantt charts for planning and tracking tasks, valuing their clear timelines and task dependencies for complex projects.
Does Trello Have a Gantt Chart?
Trello does not include a native Gantt chart feature, as it is primarily built around Kanban approach. However, users can easily enhance Trello's functionality with power-ups like Planyway, TeamGantt, or BigPicture, which integrate seamlessly to provide Gantt chart capabilities.
How to Create a Gantt Chart? Core Features
Adding a Gantt chart to Trello helps you customize workflows to suit different projects. While each Gantt chart power-up is unique, all of them share the following core elements:
Date and Duration: tasks are positioned along a timeline, with bar lengths representing task duration. This makes it easy to visualize schedules and understand how long each task will take.
Dependencies: lines or arrows connect related tasks, showing the sequence and interdependencies. For example, Task B can’t start until Task A is completed.
Milestones: key dates highlight major project phases or deadlines, ensuring that important goals are tracked effectively.
Progress Bars: visual indicators show how much of a task is completed versus how much remains, providing a quick snapshot of project status.
Filters: these tools let you narrow down your view to specific tasks, team members, or labels, helping you focus on the most relevant information.
Color Coding: colors help categorize tasks, improving visual clarity and making it easier to identify task types or priorities at a glance.
8 Top Gantt Chart Tools for Trello
We’ve thoroughly explored and tested Trello power-ups with Gantt chart features, combining our hands-on experience with user reviews. Now, we’re excited to share our findings with you: Brief reviews about all products:
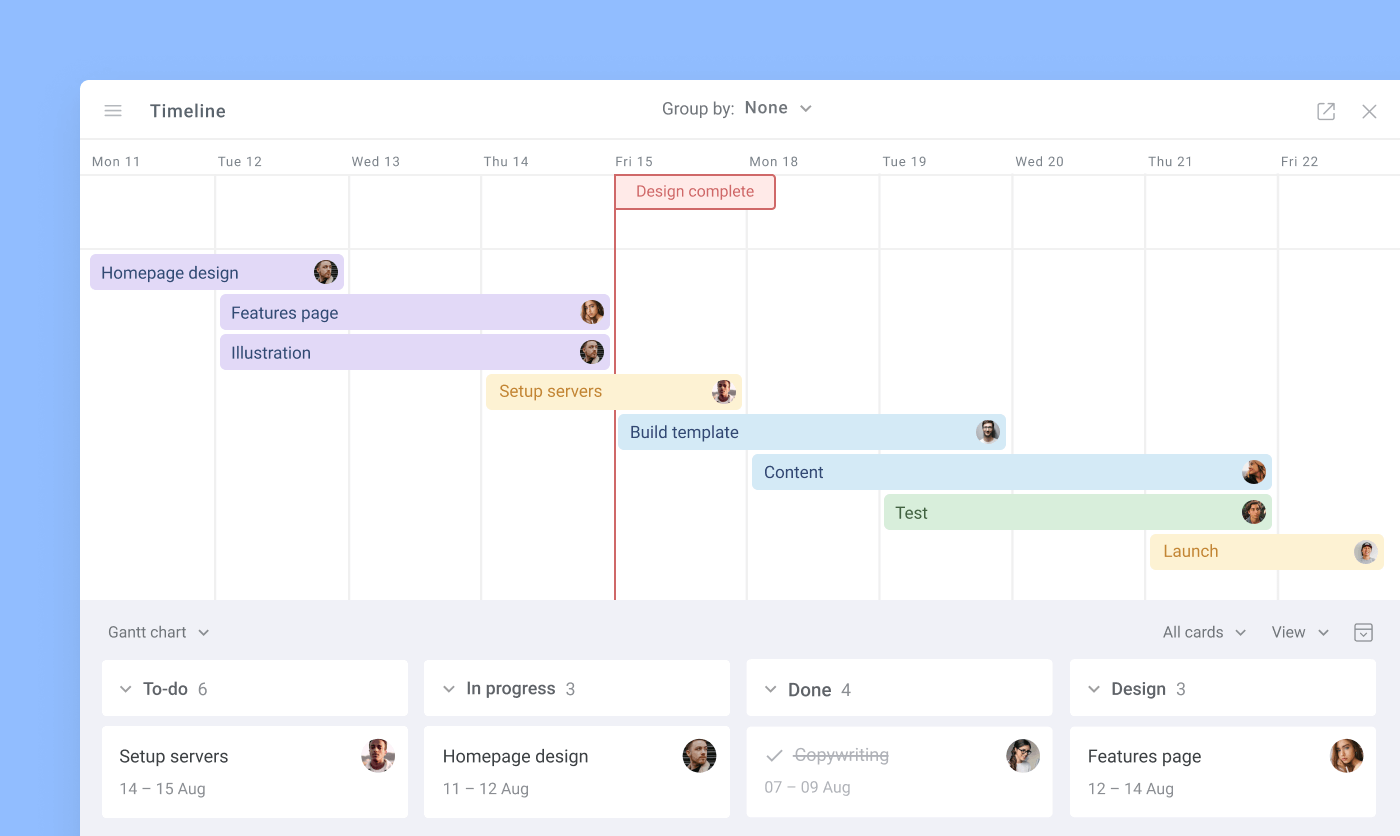
1. Planyway
Planyway is a top choice among Trello power-ups for project managers, trusted on over 250,000 boards. It boosts project visibility and streamlines workflow management, offering a versatile feature set that works for teams of any size or methodology.
Key Features of Planyway:
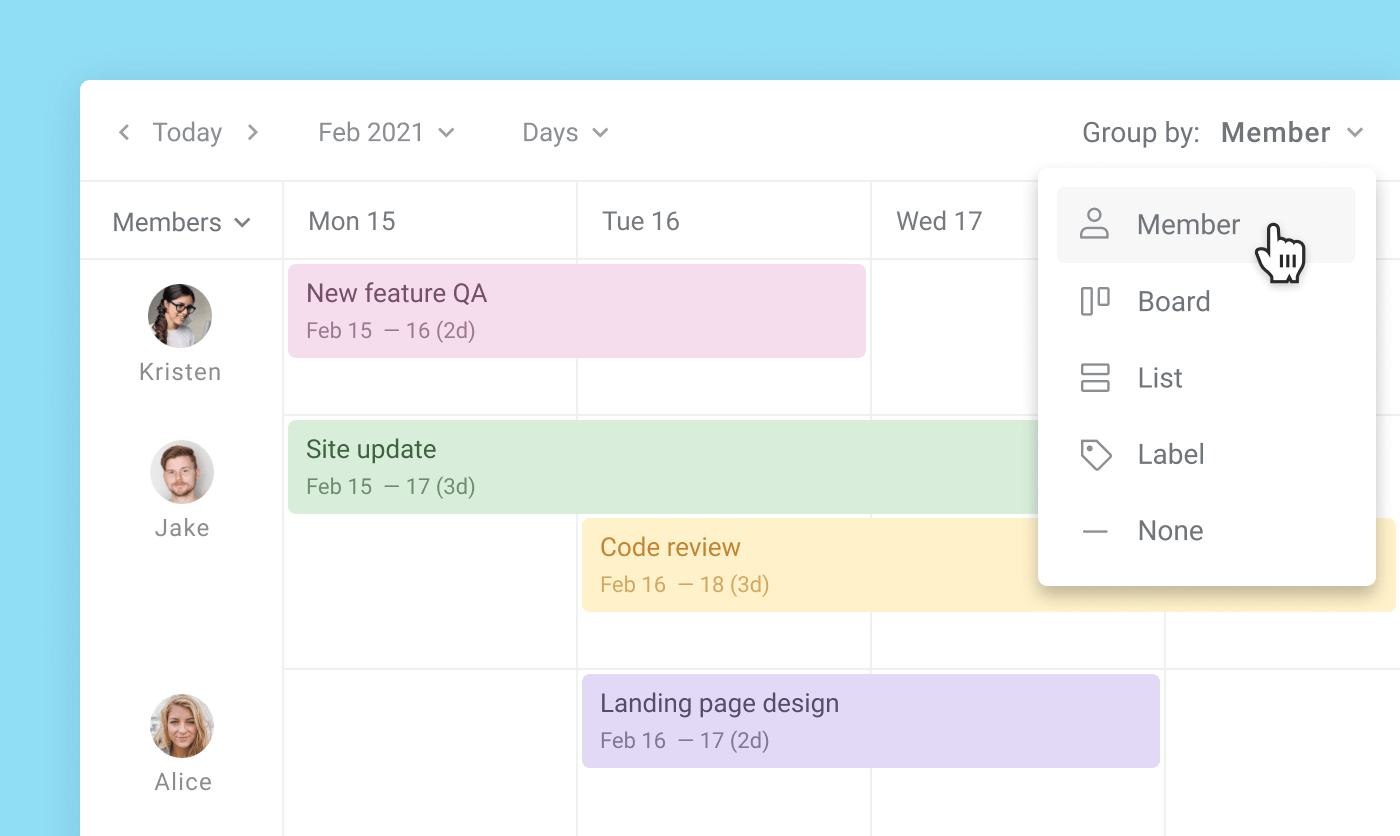
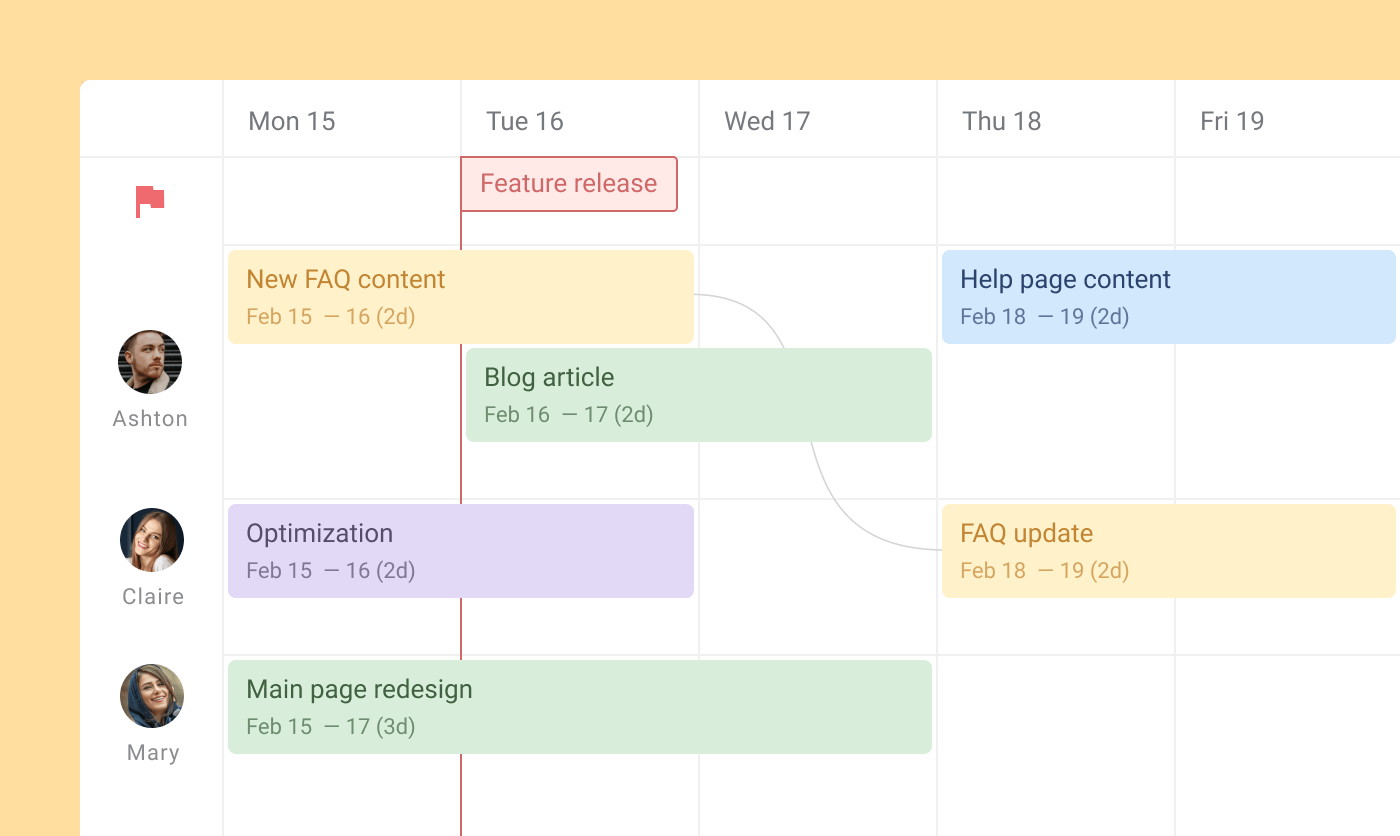
Flexible Gantt Charts: offers multiple ways to view project timelines, from a high-level overview to detailed groupings by team members, projects, lists, or labels.
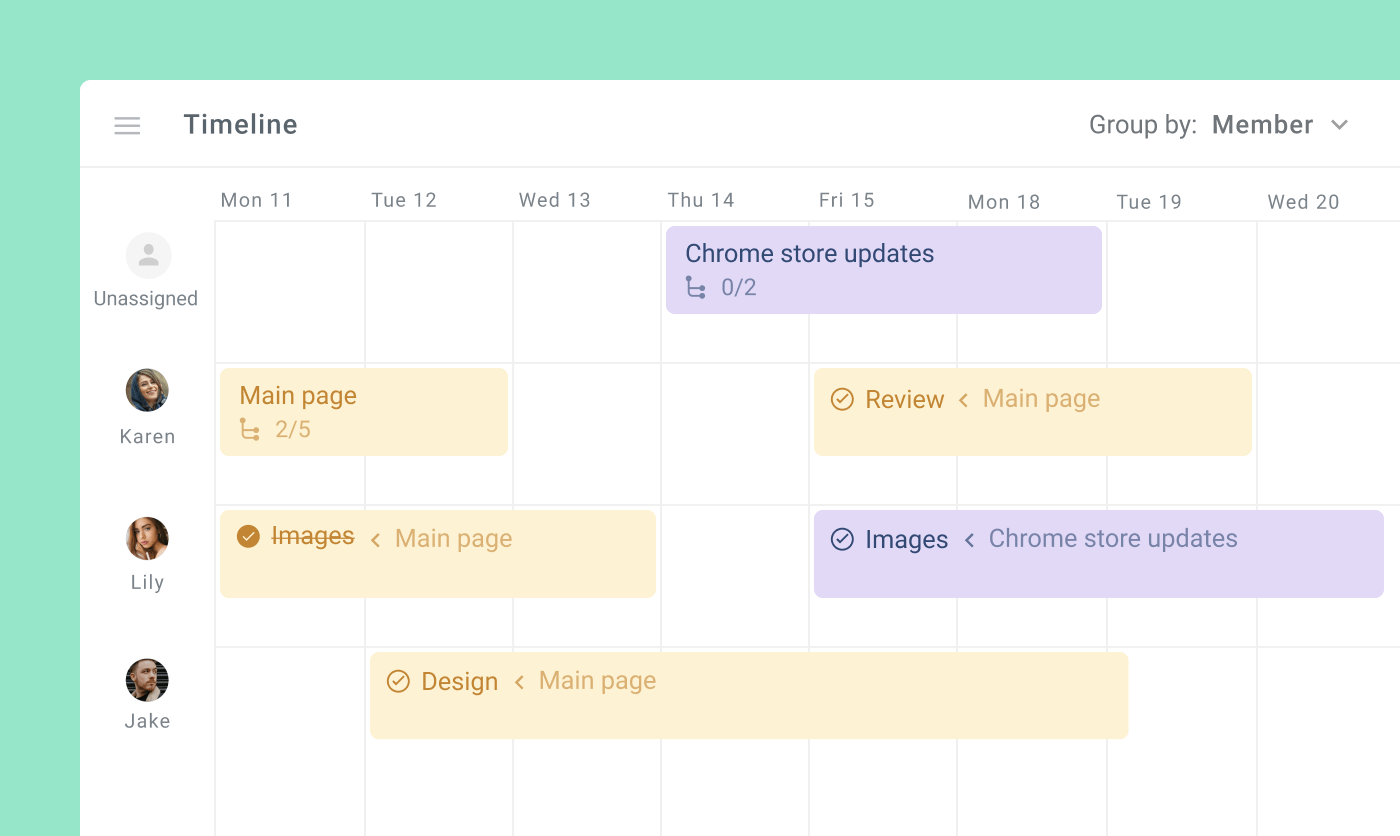
Resource and Activity Planning: easily organize tasks by team members to visualize workloads and identify who is handling what. Plan future activities effortlessly with drag-and-drop functionality.
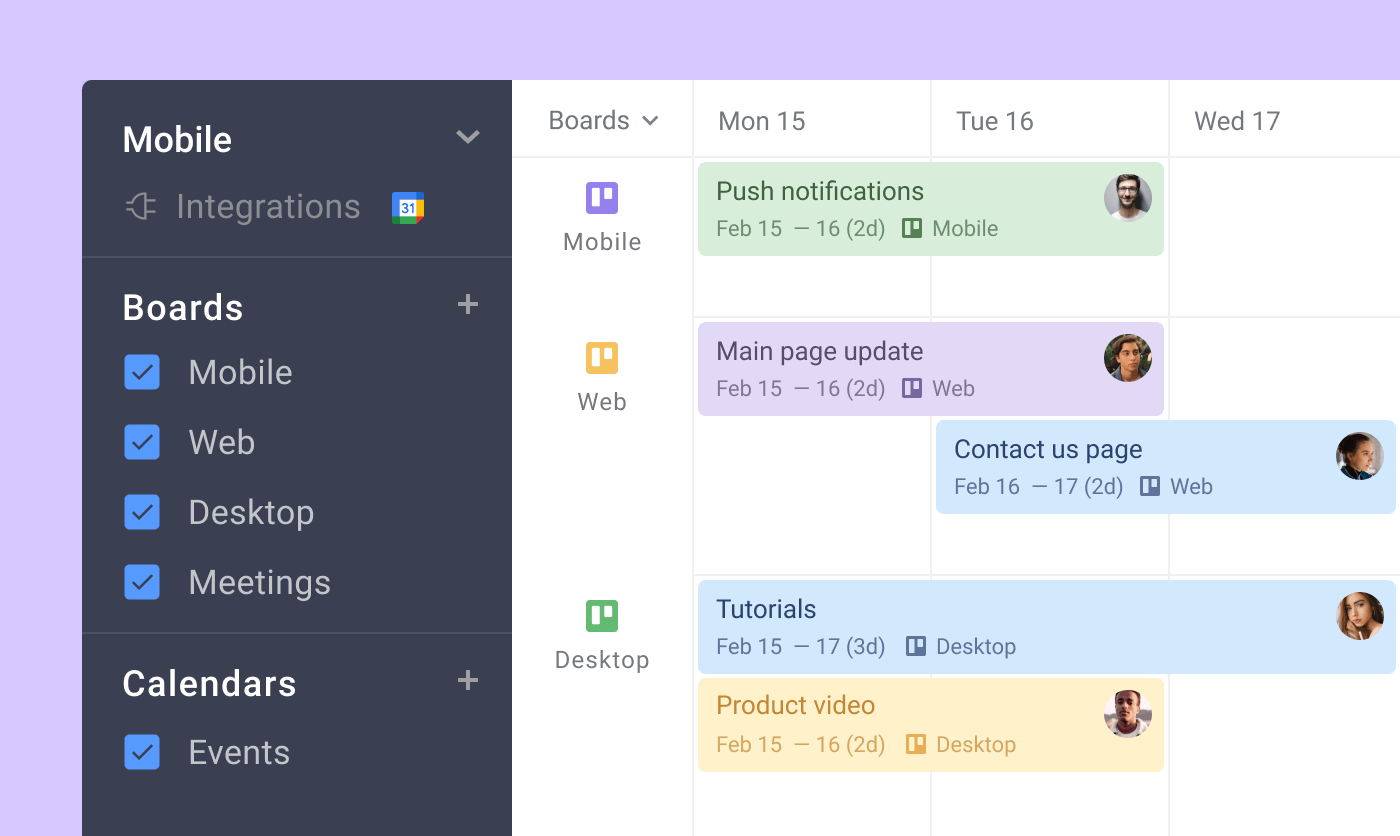
Multi-Board View: combine tasks from multiple Trello boards into a single Gantt chart for a comprehensive project portfolio view.
Time Tracking Capabilities: helps track work progress and optimize planning with real-time data insights.
Advanced Hierarchies: visualize Trello checklists on the timeline, treating them as subtasks to add structure and hierarchy to your projects.
Milestone Highlight: transform regular cards into milestones to highlight deadlines clearly and keep everyone on track.
Dependencies: link tasks visually to display dependencies, though these must be adjusted manually when rescheduling dependent tasks.
Export Options: export Gantt charts directly to PDF to share with stakeholders, or in the Excel format for further analysis, reporting, or presentation.
User Review
"Planyway transformed how our team works. The multi-board view helps us see the big picture, and the timeline feature ensures we never miss a deadline. The resource planning, time tracking, and milestone visualization have made our workflow much smoother. It's a must-have for Trello users managing complex projects." – Sarah L., Project Manager
2. TeamGantt
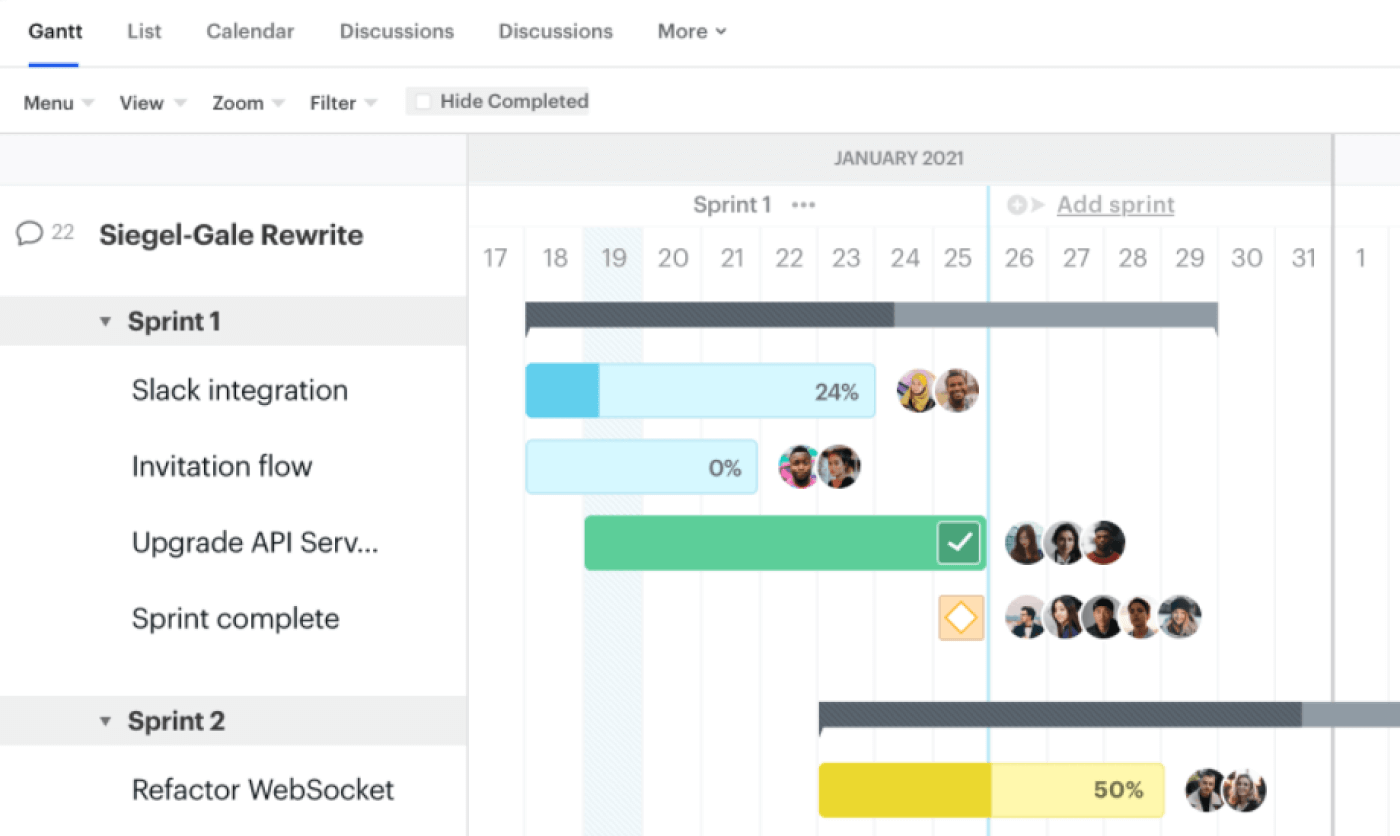
TeamGantt is an excellent option for those seeking a more traditional Gantt chart experience within Trello. Its intuitive design and straightforward features make it ideal for teams focused on clear scheduling and task tracking.
Key Features:
Task Synchronization: ideal for teams wanting control over which tasks appear on the Gantt chart, especially if not all tasks require scheduling.
Progress Tracking: input task completion percentages directly, which update the progress bar to reflect real-time status.
Dependency Management: dependent tasks automatically adjust their schedules if the parent task is rescheduled, reducing manual updates.
Checklist Support: checklist items remain accessible inside the card but cannot be visualized directly on the chart.
3. Projects by Placker
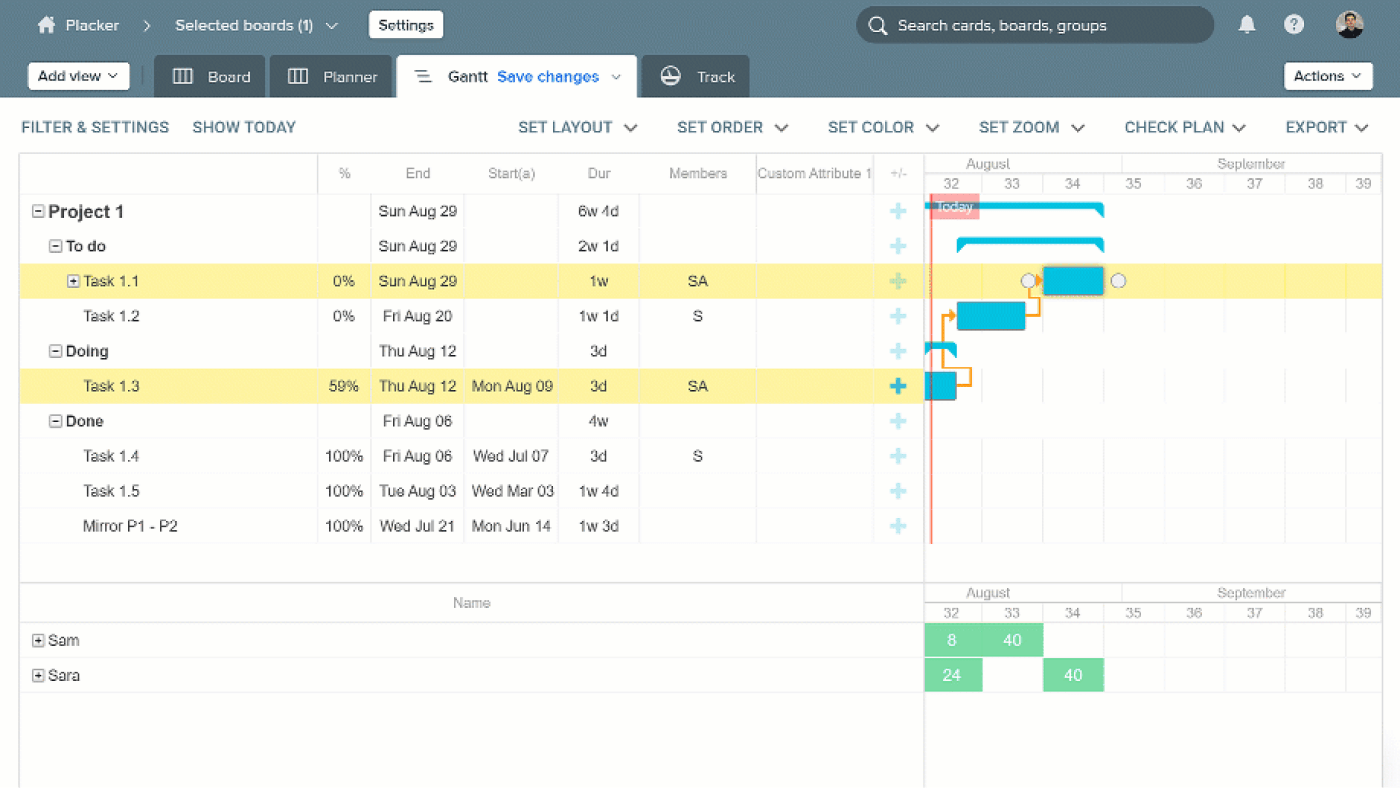
Projects by Placker offers a traditional Gantt chart experience but stands out with checklist visualization and advanced task organization.
Key Features:
Comprehensive Task Visualization: displays not only tasks but also checklist items.
Dependency and Progress Management: includes dependency tracking and progress bars to keep workflows aligned and transparent.
Multi-Board View: combines tasks from multiple Trello boards into a single Gantt chart.
Report: gain actionable insights, track progress, and make informed decisions with ease.
4. BigPicture
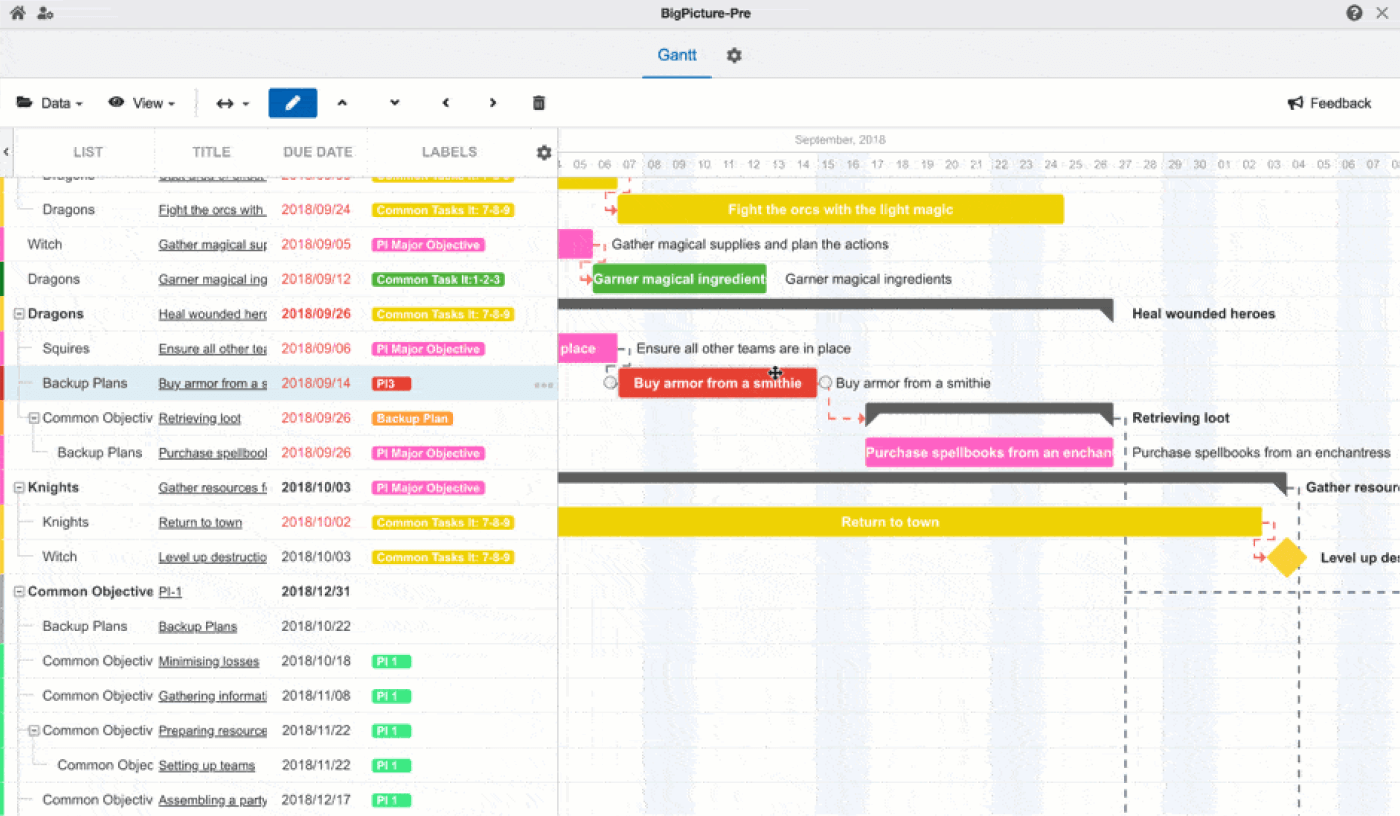
BigPicture, originally a Jira add-on, has seamlessly transitioned to Trello, offering a visually appealing and highly functional Gantt chart solution. Its vibrant interface and robust features make it a favorite for teams handling complex projects that require detailed planning and task management.
Key Features:
Advanced Task Organization: sort and group Trello cards by lists, due dates, titles, labels, members, or statuses.
Dependency Management: offers a Task Mode setting, enabling users to choose whether tasks should be automatically recalculated based on dependencies.
Lock Mode: includes a Lock Mode to prevent accidental changes to the Gantt chart, ensuring stable project planning.
Critical Path Analysis: highlights the critical path—the longest sequence of dependent tasks affecting the project duration—in red, helping teams prioritize key activities.
5. Airfocus Strategy, Roadmaps, Prioritization
Its collaborative approach to decision-making and intuitive interface make it a valuable tool for teams aiming to align priorities with business goals while leveraging Gantt roadmaps for visualization.
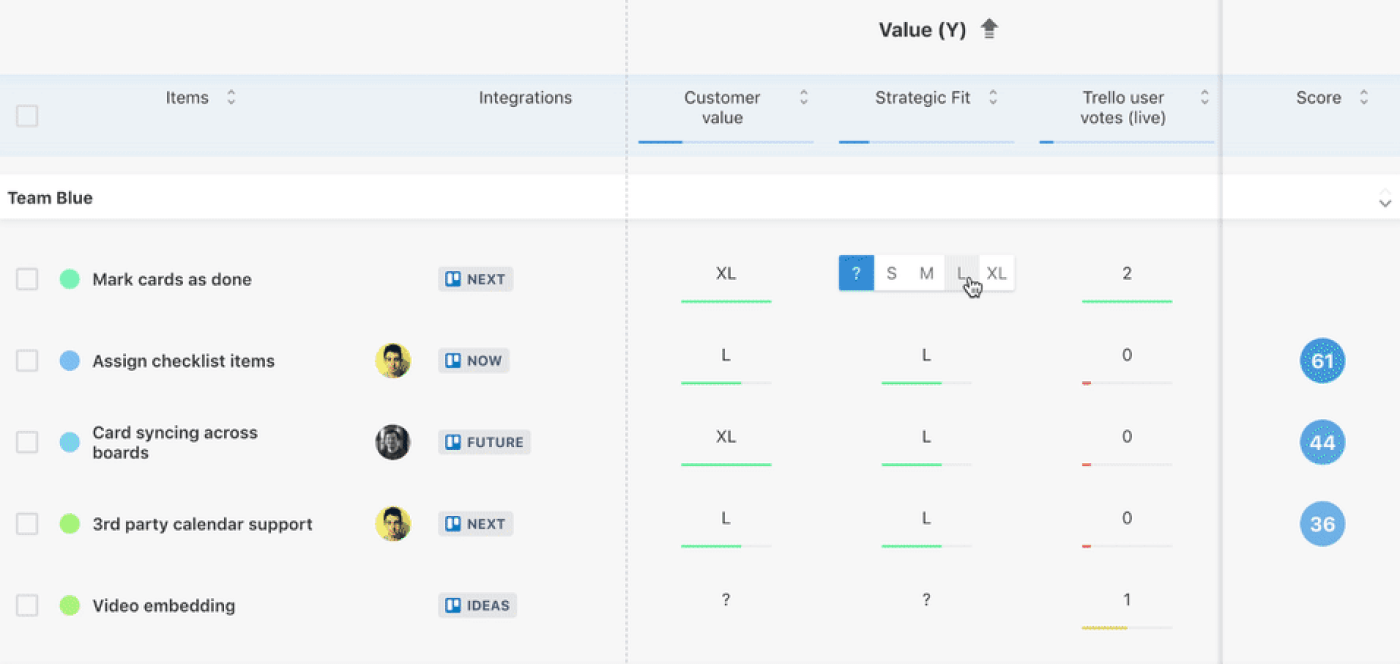
Key Features:
Prioritization Templates for Easy Setup: offers customizable prioritization templates designed to help beginners get started quickly.
Collaborative Task Prioritization: enables all team members to contribute to task scoring, fostering a collaborative and transparent prioritization process.
Priority Scoring: automatically generates a priority score for each task, which appears within Trello cards and the Airfocus interface.
Gantt Roadmaps: transition from prioritization to actionable planning by visualizing prioritized tasks on a Gantt chart.
6. Ganttify
Ganttify is a straightforward Gantt chart solution that brings Excel-like simplicity to Trello. Its intuitive drag-and-drop interface and focus on precision make it ideal for teams seeking basic functionality with advanced timeline scaling options.
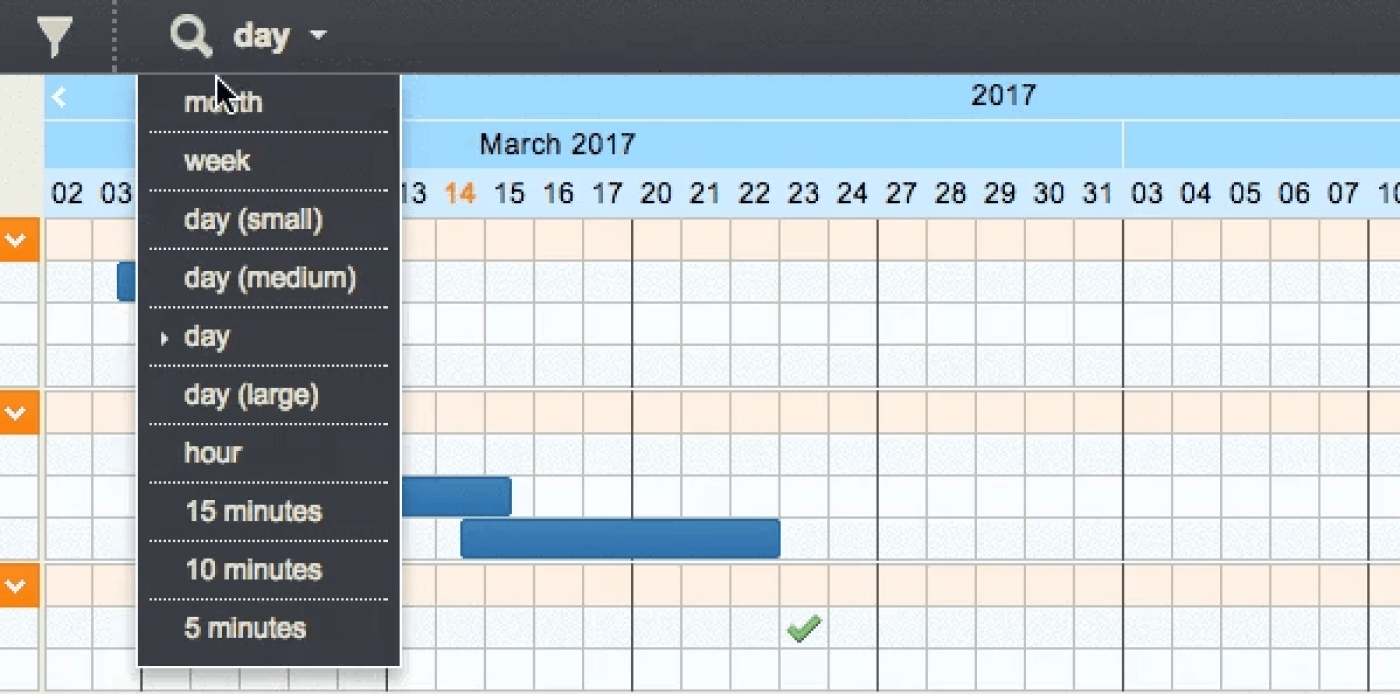
Key Features:
Excel-Like Interface: Ganttify’s interface resembles an Excel sheet, offering a familiar and intuitive layout for users.
Core Gantt Chart Features: Includes essential features like drag-and-drop task management, card resizing (stretching and shrinking), and dependencies with automatic updates.
Automated Dependencies: automatically updates dependent tasks when changes are made, reducing manual effort and minimizing errors.
7. GoodGantt
Good Gantt is a robust Gantt chart tool designed for Trello users who need advanced planning capabilities with seamless integration.
 Key Features:
Task Management: supports drag-and-drop scheduling for effortless timeline adjustments.Enables stretching and shrinking of task durations, providing flexibility to adapt to changing project needs.
Task Grouping: group tasks to build any hierarchy to keep track of the progress.
Workload Panel: see for the load of your team members and evenly distribute the load between them using the access panel.
8. Mermaid Gantt
With just a click, you can visualize your project timelines, filter key dates, and share or export charts for seamless collaboration with team members and stakeholders.
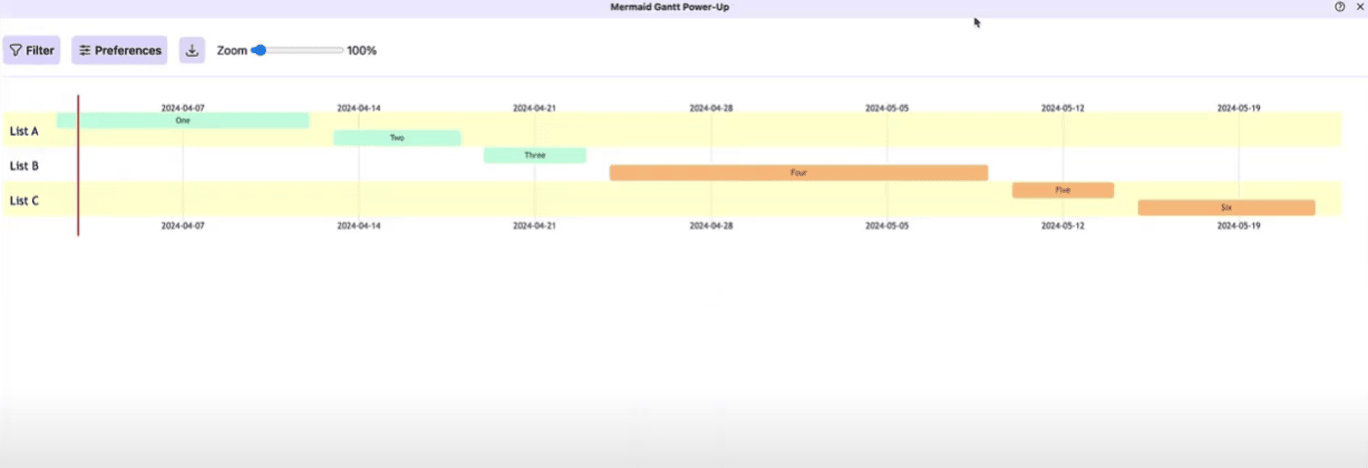 Key Features:
Workspace Reports: transform the Gantt view into insightful reports.
Easy Sharing and Export: share charts with your team or stakeholders by downloading them as PNG image files.
Activity Calendar: identify busy time in your board with a heatmap style grid.
FAQ: Gantt Charts and Their Applications
How to choose the best Gantt Chart tool for your team’s size or project type?
Selecting the right Gantt chart tool for Trello depends on your team’s size, the complexity of your projects, and specific workflow requirements:
Team Size and Collaboration Needs: for smaller teams, tools like TeamGantt provide simplicity and easy-to-use features, perfect for straightforward Trello project management. Larger teams handling complex, cross-departmental workflows can benefit from advanced tools like BigPicture, which offer multi-board views and robust task dependency management. The Planyway app strikes a balance, making it a great fit for both small and large teams.
Project Complexity: if your projects involve multiple phases, interdependent tasks, or critical path analysis, opt for tools like Planyway or BigPicture, which provide detailed timeline planning, milestones, and dependency tracking.
Customizability and Flexibility: agile teams may prefer tools like Planyway that support agile Gantt charts, allowing for iterative planning and resource adjustments. Traditional projects with fixed timelines may be better served by TeamGantt for its robust dependency management.
Integration and Scalability: consider tools that integrate seamlessly with your existing Trello setup and other platforms your team uses (e.g., Google Calendar, MS Teams). For scalable solutions, ensure the tool supports multi-board views and advanced sorting options.
How to Implement Gantt Charts across industries?
Gantt charts are highly versatile and can be implemented across various industries to enhance project planning and execution.
Construction and Engineering: schedule milestones, manage dependencies, and visualize timelines for complex projects like building developments or infrastructure upgrades.
Marketing and Advertising: plan campaigns, track deliverables, and align cross-functional teams on timelines.
Software Development: map out product launches, sprint cycles, and interdependent tasks to keep teams agile and on schedule.
Event Management: organize event timelines, assign tasks, and manage vendor deadlines efficiently.
Education: plan semester timelines, assign resources for courses, and track progress on academic projects.
How do Gantt Charts improve team collaboration?
Gantt charts improve collaboration by providing a shared visual timeline for all team members. They:
Enhance Visibility: allow everyone to see the big picture, including task dependencies, deadlines, and overall progress.
Clarify Roles: assign tasks to specific team members, ensuring accountability and reducing overlaps.
Simplify Communication: act as a single source of truth for project updates, reducing the need for constant meetings or follow-ups.
Facilitate Adjustments: enable real-time updates to timelines, so changes are immediately visible to all team members.
Promote Transparency: ensure everyone knows what is expected, who is responsible, and how individual tasks contribute to the project's success.
Do Gantt Chart tools integrate with other project management software?
Yes, most Gantt chart tools integrate seamlessly with other project management software to enhance functionality.
Jira: tools such as Planyway, BigPicture and Airfocus offer advanced Gantt chart capabilities for Jira users.
Calendar Apps: tools like Planyway sync with Google Calendar, Outlook, or iCal to provide unified scheduling.
Communication Tools: some Gantt chart tools integrate with Slack, MS Teams, or email platforms to keep team members informed of updates.
File Sharing: Integration with platforms like Dropbox or Google Drive allows for seamless sharing of resources tied to tasks..
Final Thoughts
Gantt charts are the most popular way to go for many projects, especially project planning and execution, and as you see, it’s really simple to create your own without leaving your old buddy Trello.
There is a huge range of different power-ups granting you both traditional Gantt or the polished versions allowing you more freedom and flexibility. So, just get started with the one that matches your feature expectation, and surely, you’ll become pretty much a Gantt chart wizard soon!